
Monitoring purposes SPX; Neutral.
Monitoring purposes Gold: Gold ETF GLD long at 173.59 on 9/21/11.
Long Term Trend monitor purposes: Flat
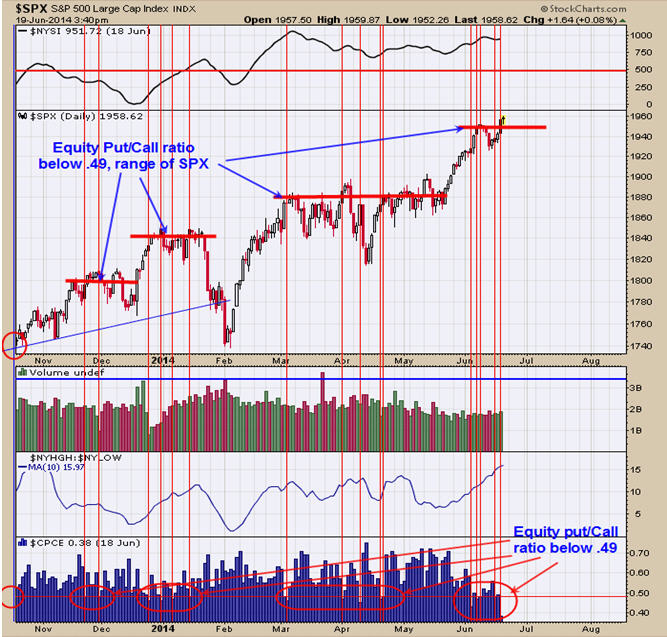
The above chart shows the Equity put/call ratio (bottom window) and where it corresponds to the SPX. When the Equity put/call ratio falls below .49 (marked with vertical red lines) it usually marks a stalled period in the SPX. We started to see a slew of equity put/call ratios below .49 in early June and suggested the SPX was stalling out. We have marked previous times with red vertical lines when the equity put/call ratio had a cluster of reading lower than .49 and in each time the market stalled. We have a cluster now near 1950 range of the SPX a stall here is possible. There are other option studies suggests a stall in the market near current levels. Could be a trading range developing before another rally begins. Bigger picture is bullish but last weeks low could be tested.
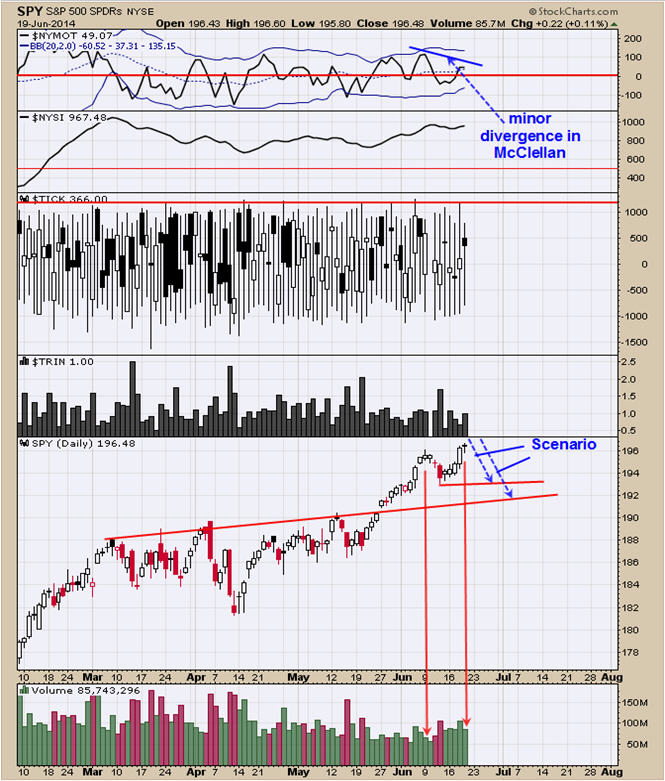
Today the market pushed to a new high and Volume dropped and a bearish candlestick pattern formed called a “Doji” and two short term bearish signs. The top window is the McClellan Oscillator which made a lower high and a short term divergence. The news is out considering the FOMC meeting and nothing to spur the market right now. Tomorrow is the end of Option expiration and ends the bullish bias. Nothing big to downside but could test last weeks low near 193 or back to Neckline support near 191. Page one shows when the Equity put/call ratio gets near .49 or lower in a price range than market usually stalls and we are expecting that here
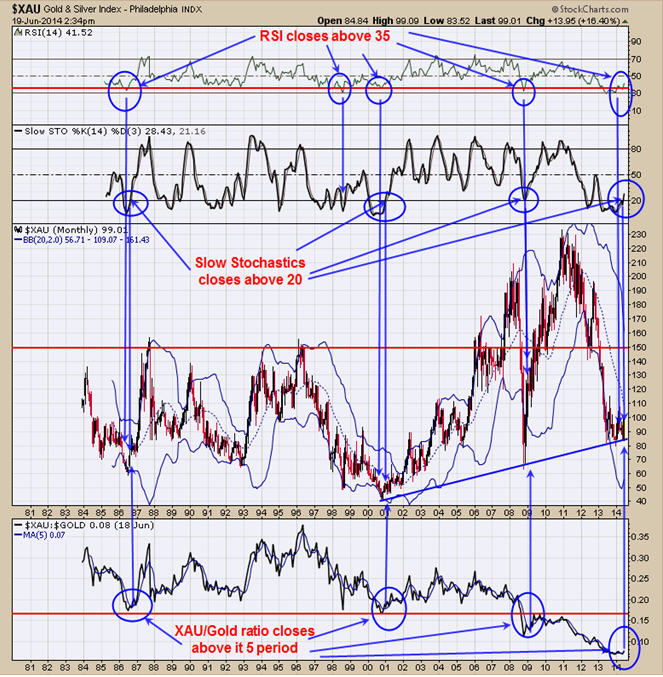
A long term bullish signal has been triggered on the XAU for the month timeframe. Though the XAU needs to be near current levels or higher into month end (monthly signals are confirmed on the close of the month). But we expect this signal to be in force for a long time. The chart above is the monthly chart of the XAU. The bullish signal comprises of three monthly indicators which are the RSI, Slow Stochastics and XAU/Gold ratio. The top window is the monthly RSI for the XAU. A bullish sign is triggered when the RSI trades below 35 and than closes above 35 (Check). Next indicator for a bullish signal is the monthly Slow stochastics for the XAU. This indicator needs to trade below 20 and a close above 20 triggers a bullish signal (Check). The last indicator is the monthly XAU/Gold ratio (bottom window) and this indicators needs to close above its 5 period moving average (check). All three indicators have been triggered this week and suggest a longer term bullish trend has begun in Gold stocks. The GDX/GLD ratio shows the value of Gold stocks to Gold and the less the ratio the cheaper gold stocks is to gold. This ratio is coming off a low that has not been lower going back to 1984 and that gold stocks are a great value. The pattern that appears to be forming on GDX is a Head and Shoulders bottom and a cycle analysis suggests the Neckline line break near 27 may take place in July.
Tim Ord
Editor
www.ord-oracle.com