
A lot of charts in this contribution today (well a picture is worth a million words). Big companies, a few segments and a battle for supremacy:
- The Big Game: AAPL (new highs, great potential, buy and hold), MSFT (great momentum), GOOG (having a hard time)
- Search Engines: YHOO gaining market share vs GOOG (… and the BABA effect)
- Ad Management and Peer to Peer (FB vs GOOG)
- Going social (FB, LNKD, TWTR)
- E-Commerce (AMZN fighting back, BABA and EBAY watch out)
- Remember the 80’s: AAPL vs IBM (what a difference 30 years make)
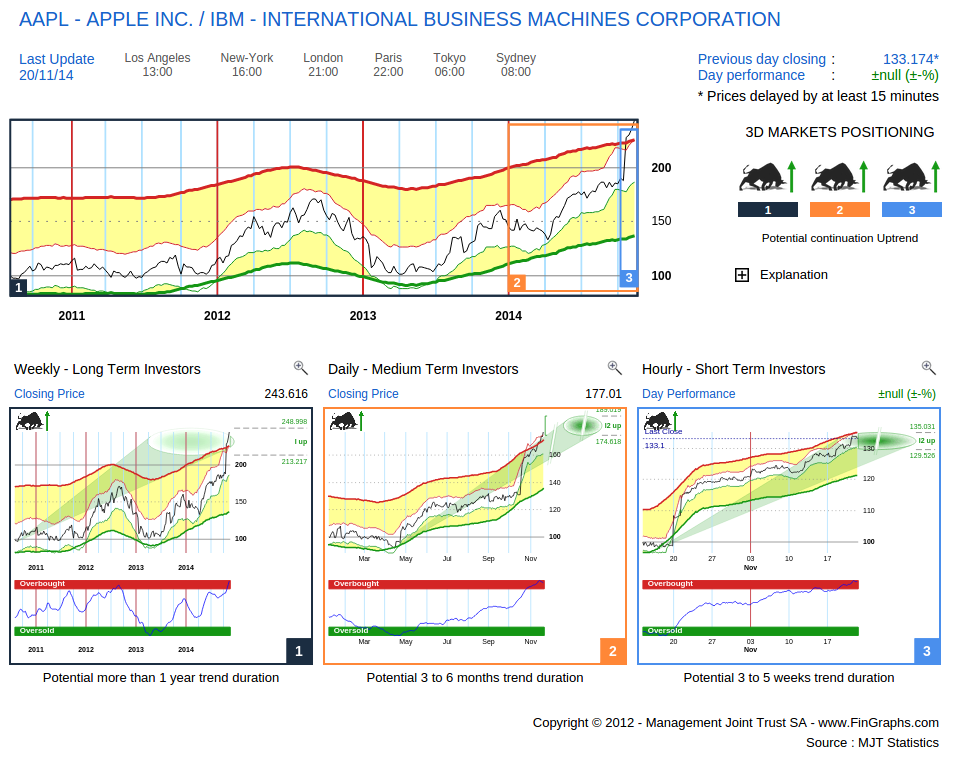
So first AAPL and new all time Highs (see chart below), … well not quite …(look closer), this is a FinGraphs chart from March 2010!
INDEED, today FinGraphs introduces a new functionality: HistoView (check-out the new scroll box and related calendar above the chart; scroll below for further explanations)
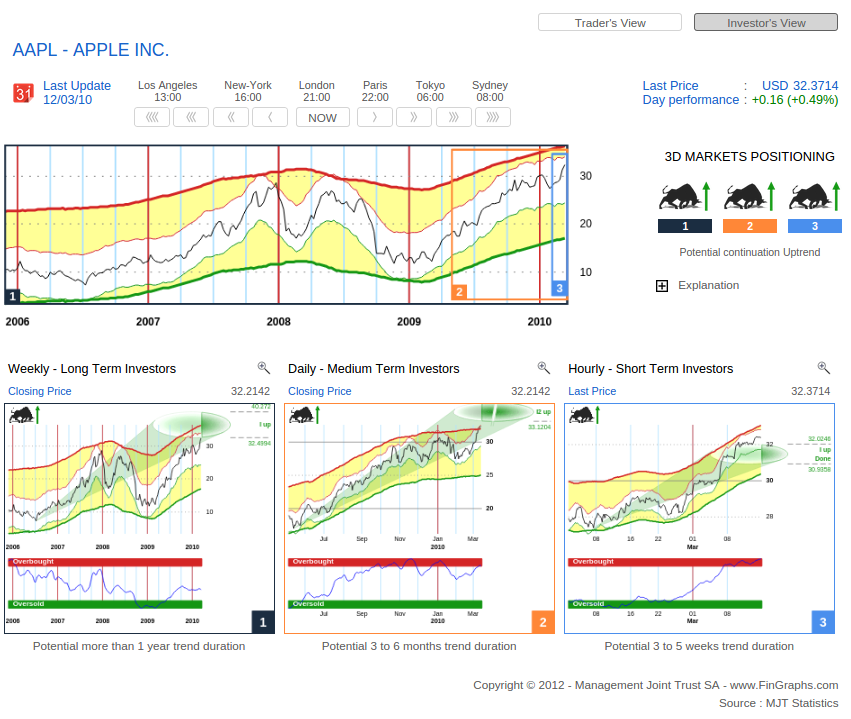
HistoView will allow you to backtest your own markets in 3D strategy by scrolling back and forth in time on all FinGraphs charts. HistoView will help you highlight how historical trends have interplayed in the past and hence allow you to get a better assessment of what to look out for today and in the future.
Already a FinGraphs subscriber? FinGraphs’ HistoView was released this morning, it is readily available on all our charts on FinGraphs.com. Did you let your subscription or your demo expire? Send us an email (support@fingraphs.com) and we will extend your account until the end of the month. If you haven’t yet registered, you can do so using the following link (7 days demo available): (http://www.fingraphs.com/#couponid-STKCHARTS14). Any difficulties, email us and we will come back to you first thing on Monday morning European time (support@fingraphs.com).
Now, back to the BIG Game (AAPL, MSFT, GOOG)
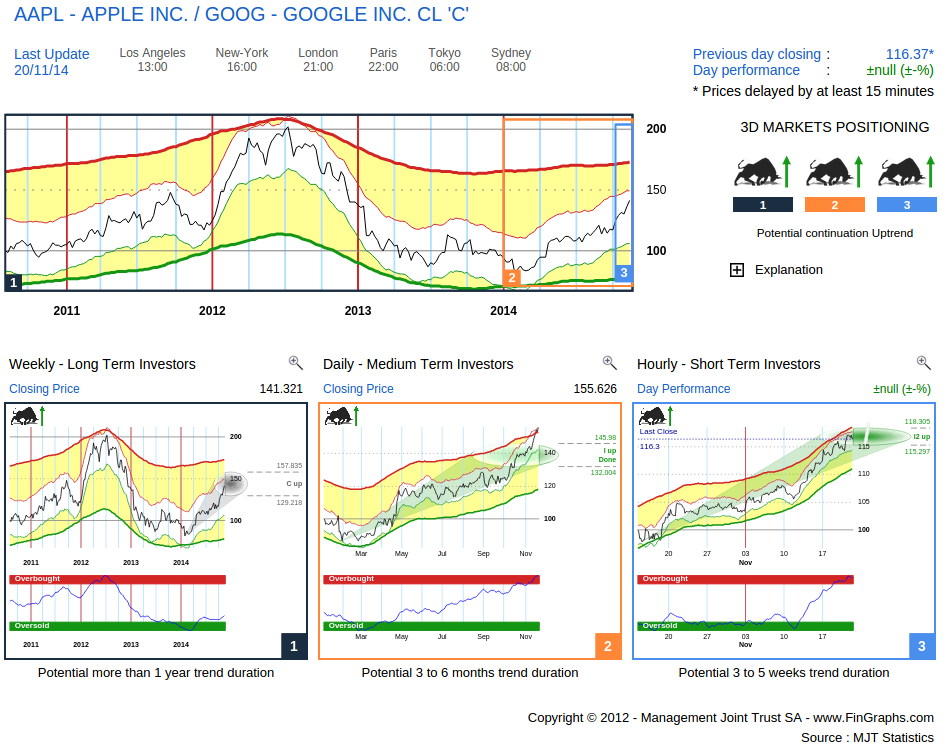
And fast forward to today. Indeed, yet again, AAPL made a new all time high yesterday. That said, the 3D view is remarkably similar to the one in 2010.
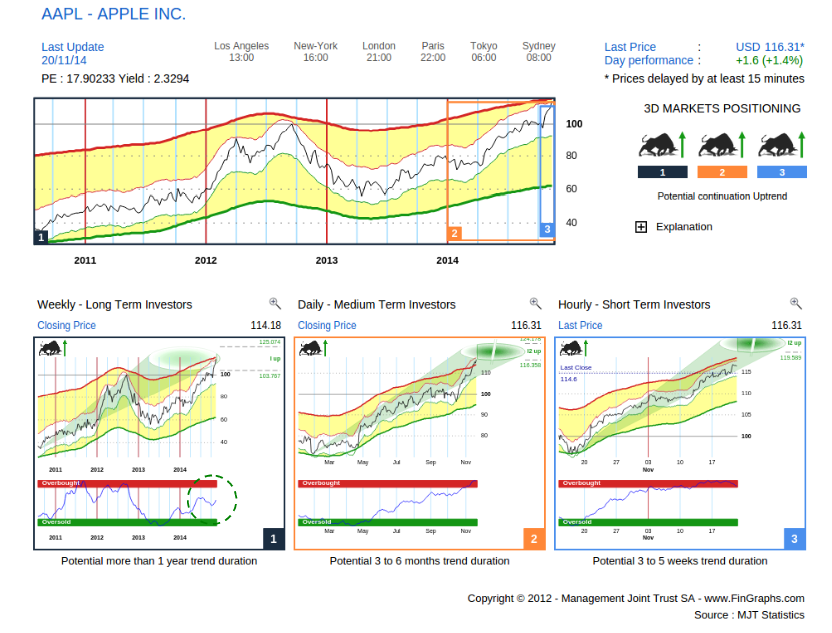
All three potential trends are heading up on this Investor’s View (a combination of a Weekly, Daily and Hourly chart). All show more potential over the next few weeks, months and quarters (our possible target zones: “green ovals”). And, yes, the picture is remarkably similar to one back in March 2010. We would like to highlight the Risk Index position on the Weekly chart (left hand chart). It is still fairly low and rising (i.e. far from being OverBought yet). This was also the case in March 2010. Back then, prices did meet their targets during 2010 and then rose gradually all through 2011 until they finally accelerated to a top in 2012. History doesn’t always repeat itself in an exact way, but following the correction during late 2012 and early 2013, it would seem that AAPL is in the early stages of a strong “Resume Uptrend”. AAPL is not immune to major market downturns (see the HistoView chart from March 2010), but when looking at the current chart, it’s BUY and HOLD for now despite new all time highs.
Let’s now turn to the US Tech sector and the other giants. On the Mosaic View below we display Weekly charts of AAPL, MSFT, GOOG vs the ISHARES U.S. Technology ETF (IYW) as well as the relative of this ETF vs the SPY (SPDR S&P500 ETF).
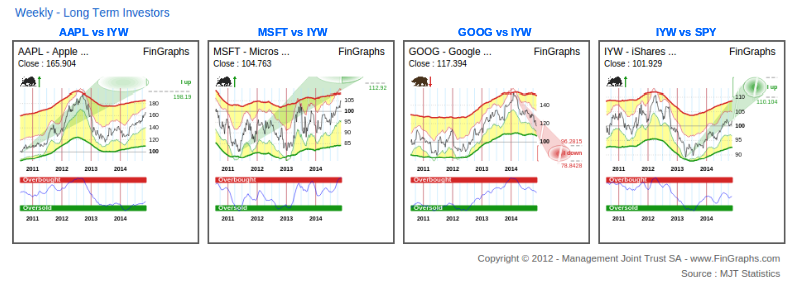
Again, AAPL (vs IYW) seems to be in the early stages of a strong acceleration, estimated price targets show strong potential and the Risk Index is only leaving the OverSold zone. MSFT (vs IYW) does also display possible price potential but its Risk Index is already OverBought, an indication of more resistance to the upside. GOOG (vs IYW) is having a hard time: it just broke through its corrective targets down, which would open the way to impulsive targets down. More generally, the IYW U.S. Tech sector relative to SPY has just broken out into impulsive territory and is now impulsive (“I up”) with yet again a Risk Index just leaving OverSold territory. The sector seems well positioned, and AAPL and MSFT seem to have more potential vs the sector.
As for the pairs, first AAPL vs MSFT:
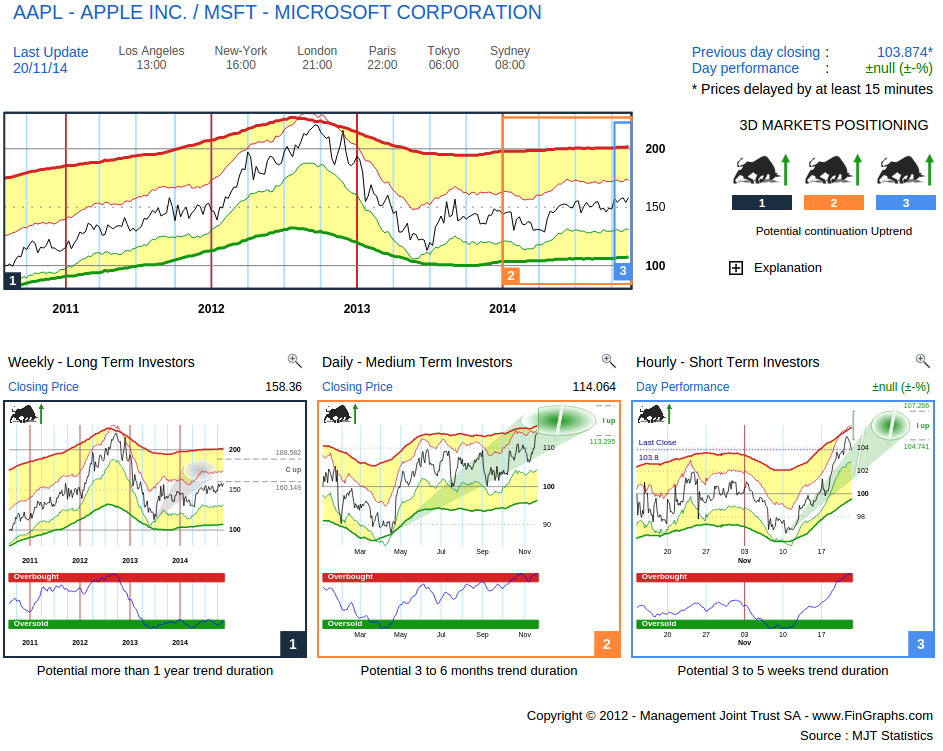
AAPL has been gaining strength. It is still corrective on our Weekly chart (left hand chart), but look at the Risk Index, slowly turning up in the OverSold zone. The Daily (middle chart) has showed strong momentum recently, is slowly approaching its targets and is within the OverBought zone. This promises a nice battle over the next few months as AAPL (vs MSFT) works through the Weekly corrective zone up. Relative price has risen, the Weekly Risk Index has remained low, always a good sign.
Now AAPL vs GOOG:
Similar momentum for AAPL (vs GOOG) although closer to breaking out into impulsive territory on our Weekly charts (left hand chart). The Daily and Hourly relative charts do seem closer to exhaustion, hence some work is expected in the short run before it may break away.
MSFT vs GOOG :
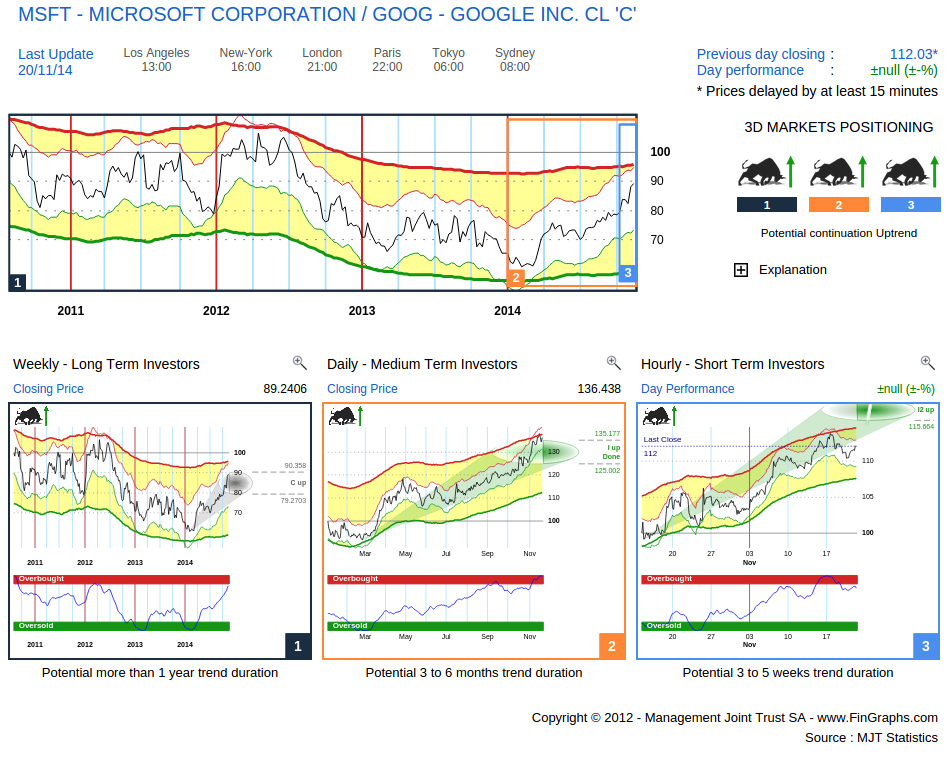
Again a similar situation, MSFT (vs GOOG) is close to breaking out into impulsive territory on our Weekly chart (left hand chart). Risk Index is closer to the OverBought zone than AAPL (vs GOOG) and the Daily chart (middle chart) is overextended. So also some work to be done around this long term resistance levels, but in essence GOOG is suffering again.
Let’s now turn to the Search Engine world:
GOOG’s Chrome main competitor in this segment is MSFT’s Bing (we’ve just reviewed the relative chart above), yet YHOO is making great progress. It is challenging Chrome as AAPL default search engine and has just won a 5 years contract to do become Firefox’s default Search engine. YHOO’s stock price is heavily tainted by its 15% participation in Alibaba (BABA), which account for circa 60 to 80% of its total valuation, we will nevertheless review the relative chart: YHOO vs GOOG:
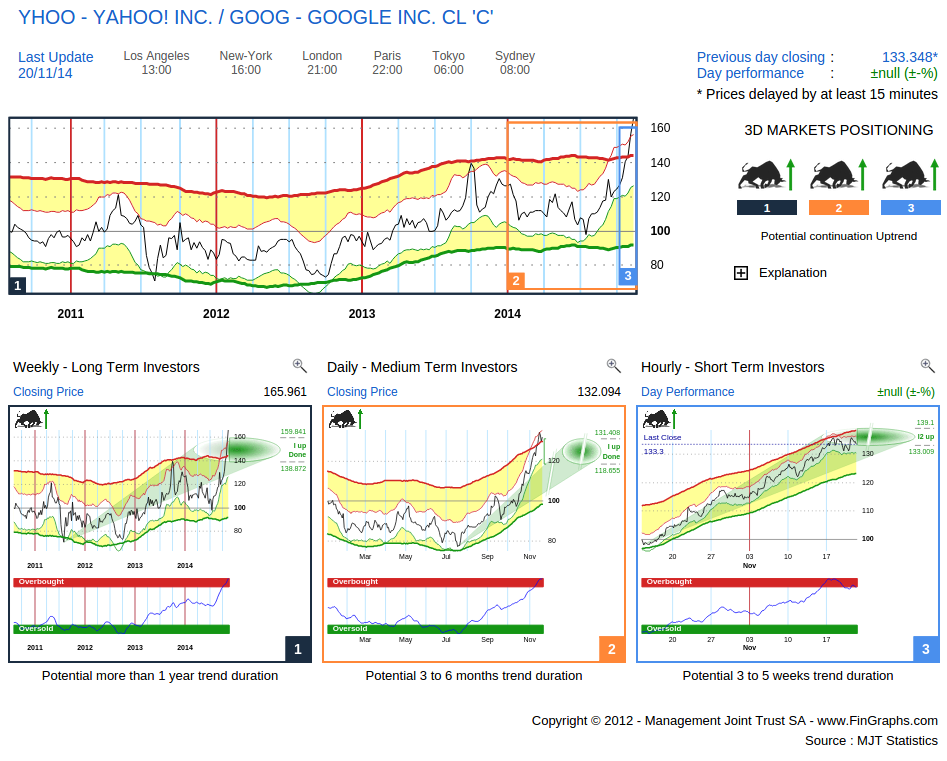
It has reached all its targets (Weekly, Daily, Hourly), yet the Weekly (left hand chart) is only just entering the OverBought zone. Looks more like an intermediate situation for now (approaching a potential intermediate top). Now, about the BABA effect (limited price history here so we’re down to a 15 minutes chart):
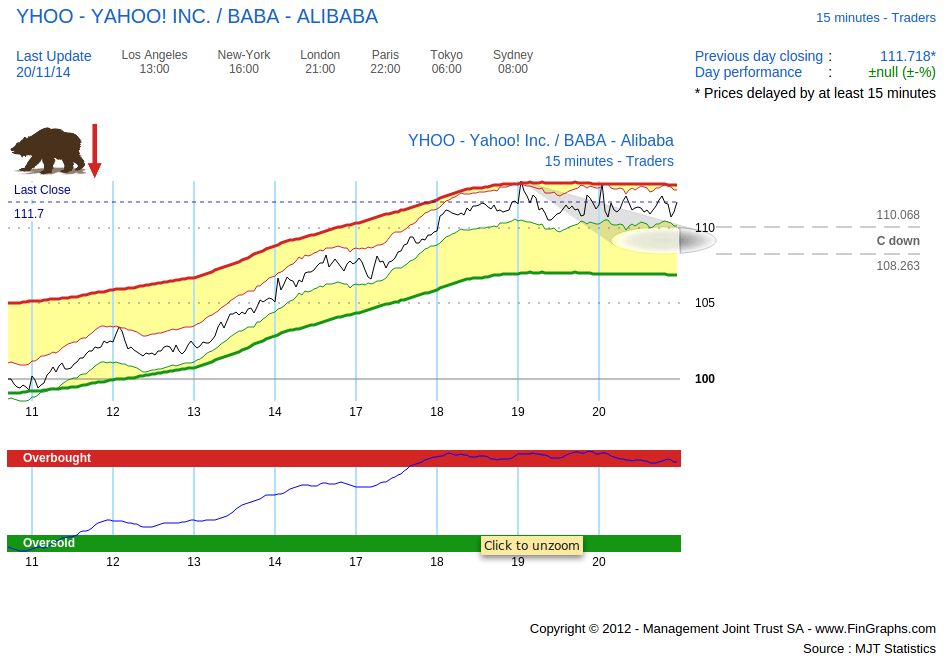
In a slight consolidation for now, following the Firefox news, but in general investors seem to be attributing increasing value to YHOO vs BABA. Is it the perspective of a slick tax deal for YHOO shareholders to spin off the BABA participation or its accelerating comeback in the Search Engine arena.? Limited scope to draw a definite conclusion from this 15 minutes chart.
Ad Management and Peer to peer:
GOOG vs FB (Google AdWords vs FB’s Atlas and YouTube vs Instagram), no Weekly chart yet on FB, so let’s consider the Daily perspective:
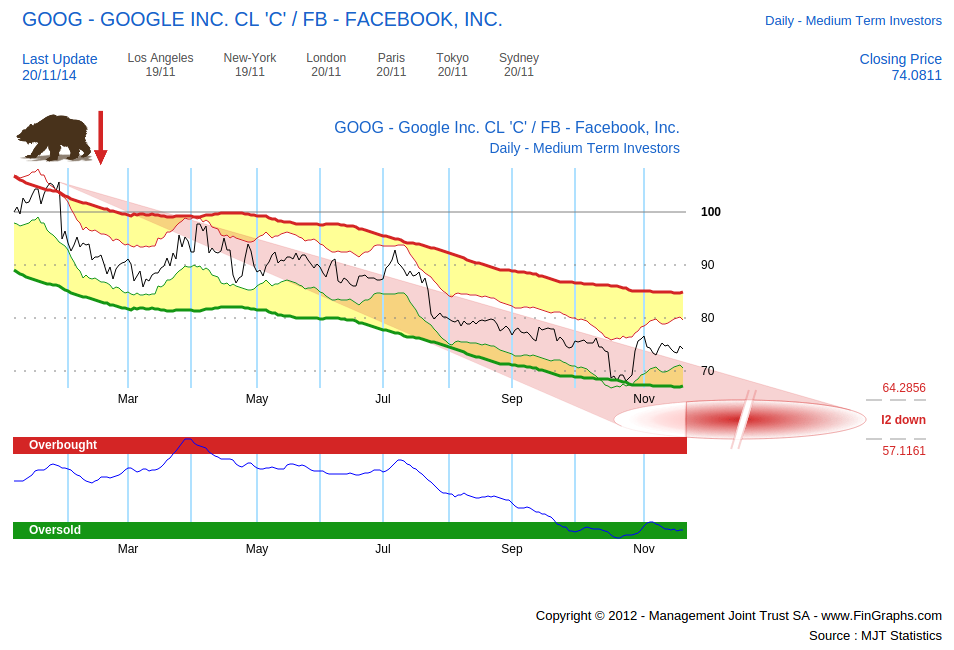
Some stabilization recently, but in general GOOG (vs FB) still heading lower relatively.
Going social:
First LNKD vs FB (no Weekly chart yet on this Investor’s View, but Daily and Hourly):
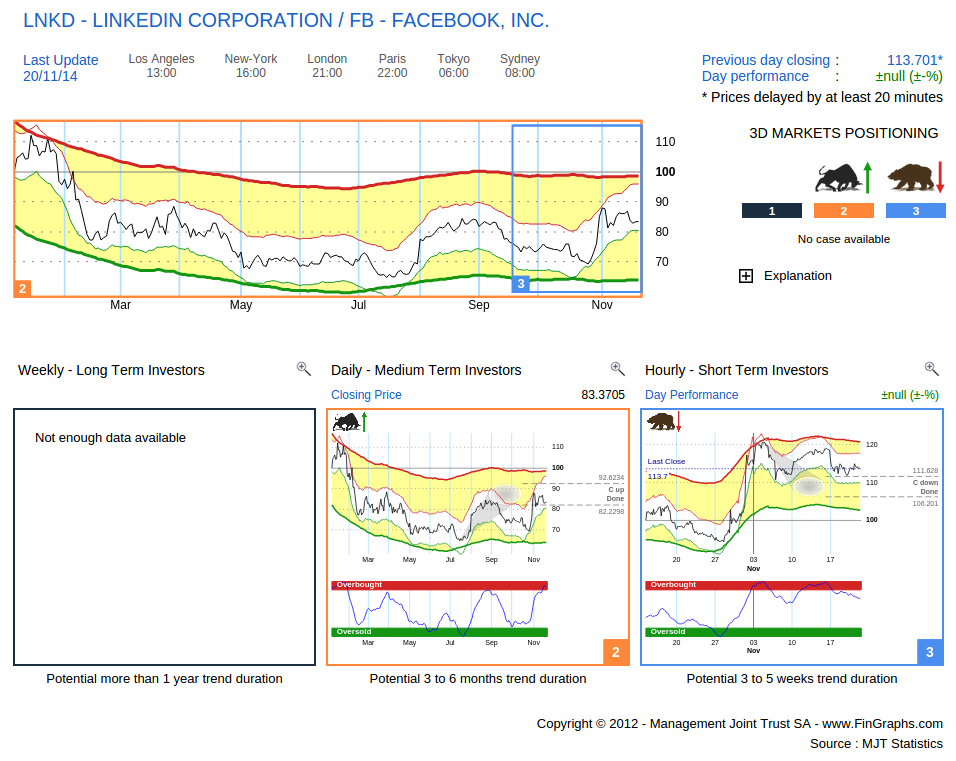
Status Quo for now. On the Daily chart (middle chart), LNKD (vs FB) has reached corrective targets up following its recent bounce (“C up done”). However, it is already OverBought which is always a caveat when prices are still only in a correction (risk has risen faster than prices, which are still only in a correction). On the Hourly chart (right hand chart), LNKD (vs FB) must hold above the lower boundary of its corrective targets down (“C down”) if it intends to confirm the recent breakout.
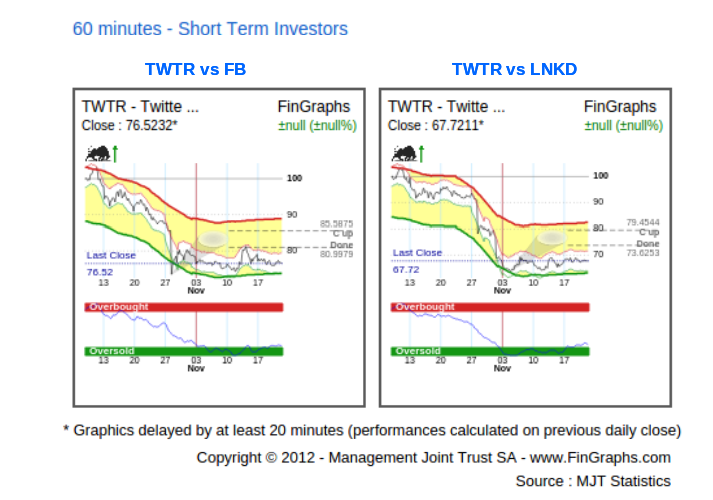
TWTR (although only 60 minutes charts are available for now) is underperforming both FB and LNKD and the current correction up vs both is unimpressive:
And finally on E-Commerce:
AMZN vs EBAY on the following Investor’s View:
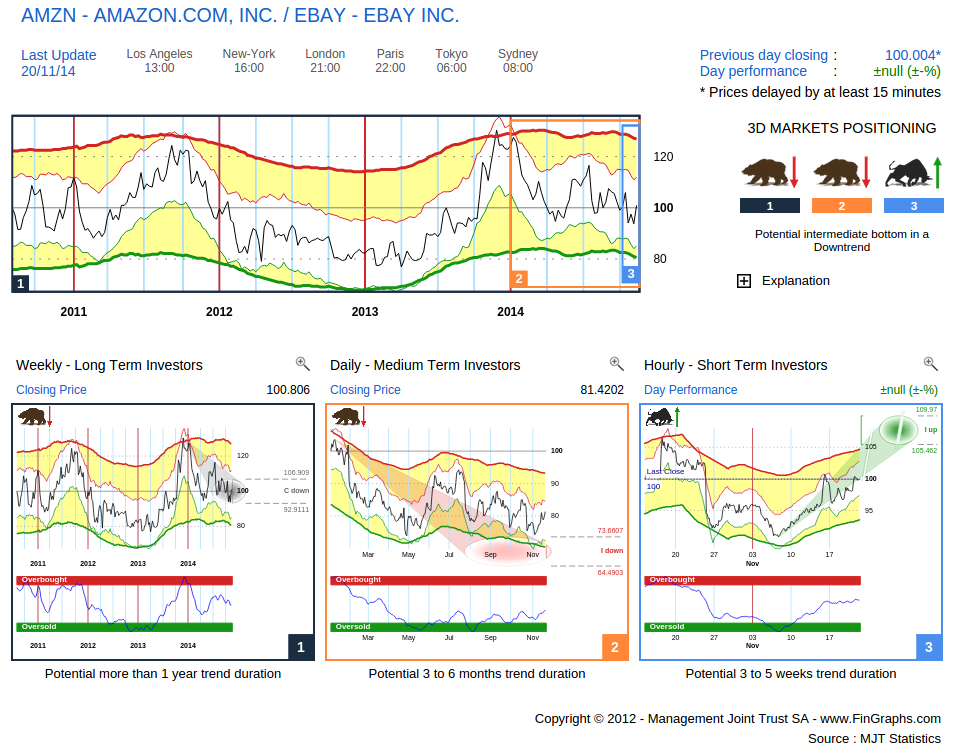
The Weekly (left hand chart) has seen AMZN (vs EBAY) find support at the lower end of our corrective targets down. The Daily (middle chart) has “pretty much” achieved its targets and its Risk Index is attempting an Uptrend out of the OverSold. Although, the Weekly Risk Index still seems menacing (a succession of lower tops), AMZN is attempting a come back. The right hand Hourly chart reflects this momentum having recently moved into impulsive territory. It is still early stages as we would wish for the Daily to turn up and become impulsive to really confirm a reversal.
And just to have a look at it BABA vs AMZN and EBAY on a 15 minutes basis:
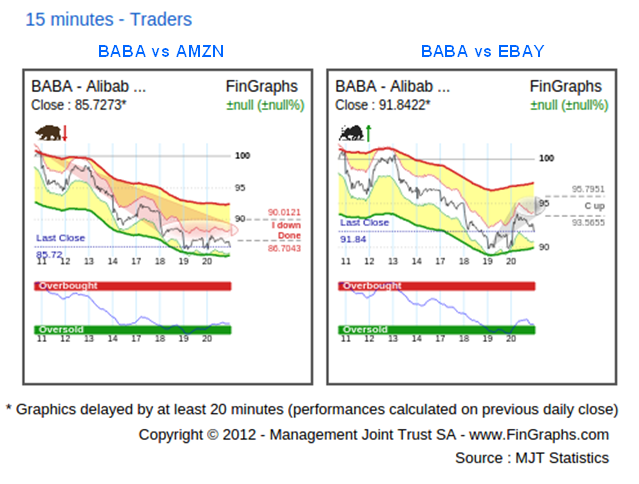
It does seem to suffer for a bit of a hangover following its impressive post-IPO rise. AMZN and EBAY are outperforming. But yet again, AMZN seems stronger than EBAY on these short term frequencies: BABA still impulsive down vs AMZN, BABA already correcting up vs EBAY.
So a lot of charts this week and we certainly haven’t covered all angles. However, we could not resist this last one: AAPL vs IBM (I grew up in the 80s and what a difference 30 years make):
One last reminder: train and test your markets in 3D with our new HistoView functionality (more at http://www.fingraphs.com).
More generally, for more information on our methodology click here (http://www.fingraphs.com/#couponid-STKCHARTS14) and then visit ‘About Us/Press release’ and ‘User Guide’ sections of our website. Clicking that link also qualifies you for a 7 day demo and a 10% discount on our services if you choose to subscribe.
Have a great weekend,
J-F Owczarczak (@fingraphs)