
Monitoring purposes SPX; Closed short SPX on 12/10/14 at 2026.14= gain 2.37%. Short SPX 12/5/14 at 2075.37.
Monitoring purposes Gold: Gold ETF GLD long at 173.59 on 9/21/11.
Long Term Trend monitor purposes: Flat
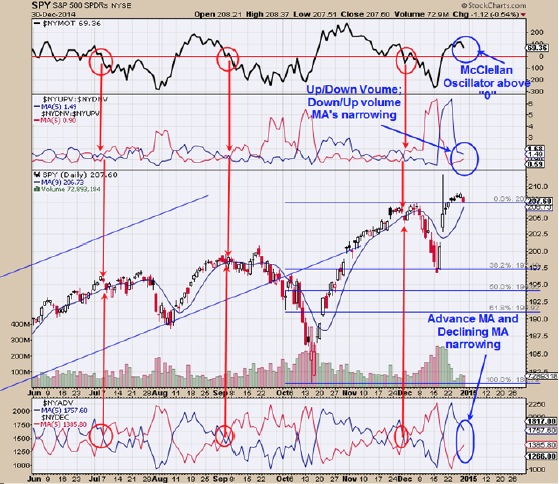
We updated this chart from yesterday. The above chart shows whether strength is interring or leaving the market. The top window is the McClellan Oscillator and reading above “0” are considered bullish for the market and today’s close came in at +69.36 down from +119.05 yesterday and shows market is weakening. Next window down is the NYSE up volume/NYSE down Volume with 5 period Moving average (blue line) and NYSE down volume/NYSE up volume with 5 period moving average (Red Line). Its a bearish sign for the market when the when the Blue line crosses below the red line. The blue and red lines are narrowing and show a weakening position but have not crossed. The bottom window is the NYSE advancing with 5 period moving average (blue line) and NYSE Declining with 5 period moving average (red line). The blue and red lines are also narrowing, and showing a weakening position but have not crossed. In conclusion; market is showing short term weakening position but have not crossed. Neutral for now.
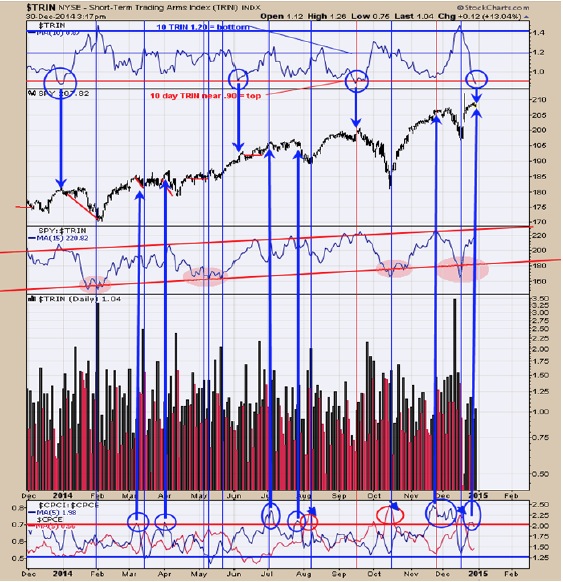
We have updated this chart from yesterday report. The bottom window is the CBOE put/call index/CBOE Put/call equity(CPCI/CPCE) (blue line). It has been a bearish short term sign for the SPY when the CPCI/CPCE reaches above 2.00 (identified with blue arrows) and current reading is 1.98 down from 2.09 yesterday. The top window is the 10 period moving average if the TRIN. When the 10 period moving average of the TRIN reaches .90 or lower, the market usually has a hard time moving higher. Current 10 period moving average of the TRIN stands at .87. Today’s modest decline can start the ball rolling to the downside. There is a cycle low due around January 6. Most worthwhile lows form when there is panic in the TRIN reading above 2.00 and something we will be watching for. Closed short SPX at 2026.14 for a gain of 2.37%; short on 12/5/14 at 2075.37.
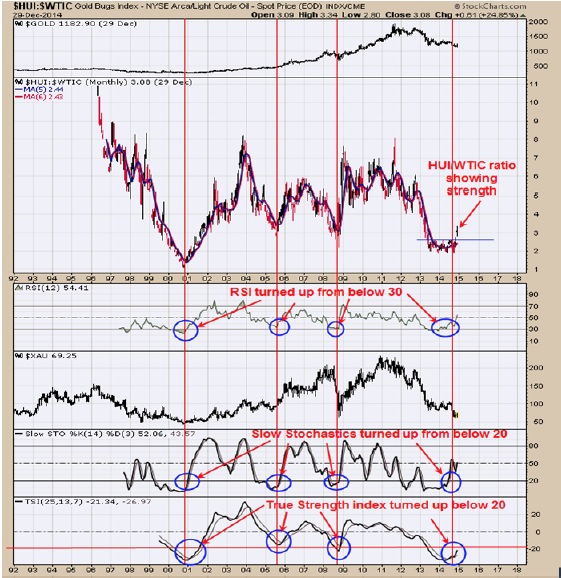
The above chart is monthly HUI/WTIC dating back to 1995. We have shown this chart in the past and is worth keeping an eye on it. HUI is the Gold bug index and the WTIC is the Light Crude oil index. This ratio picked the bottoms of 2000; 2005 and 2008. It again is giving a bullish signal here. The monthly indicators of the RSI; Slow Stochastics and True Strength index on the HUI/WTIC ratio. The bottom window is the True Strength index (TSI) and a turn up from below 20 is bullish. Next window up is the Slow Stochastics and a turn up from below 20 is also a bullish signal. The middle chart is the monthly RSI and a turn up from below 30 is also bullish. The monthly HUI/WTIC ratio also is showing short term strength and suggesting Gold stocks are making a low here. For short term the gold stocks can back and fill but the longer term picture is giving bullish signals. Once the short term picture becomes bullish we will look to establish a position.
Tim Ord,
Editor
Send email to Tim@ord-oracle.com for free 30 day trial to The Ord Oracle report.