
The support level strength in a stock chart is defined by the Market Participant Groups that created the sideways action. A critical determination in whether a stock has low risk or high profit potential, is to calculate the Point Gain Potential for the stock. It is not enough simply to identify a candlestick pattern entry signal. Short term traders must also consider where the stock will most likely encounter short selling profit taking due to “buy-on-the-dip” small lot investors, smaller funds Volume Weighted Average Price VWAP orders triggering due to High Frequency Trader HFT volume spikes, and where giant Mutual and Pension Funds use “Dark Pool Buy Zones.”
Determining these factors before entering a trade with an analysis of whether the stock has downside potential for a sell short, a Swing or Option trader reduces risk and increases the likelihood of selecting the best stock for their trading style and the current Market Condition.
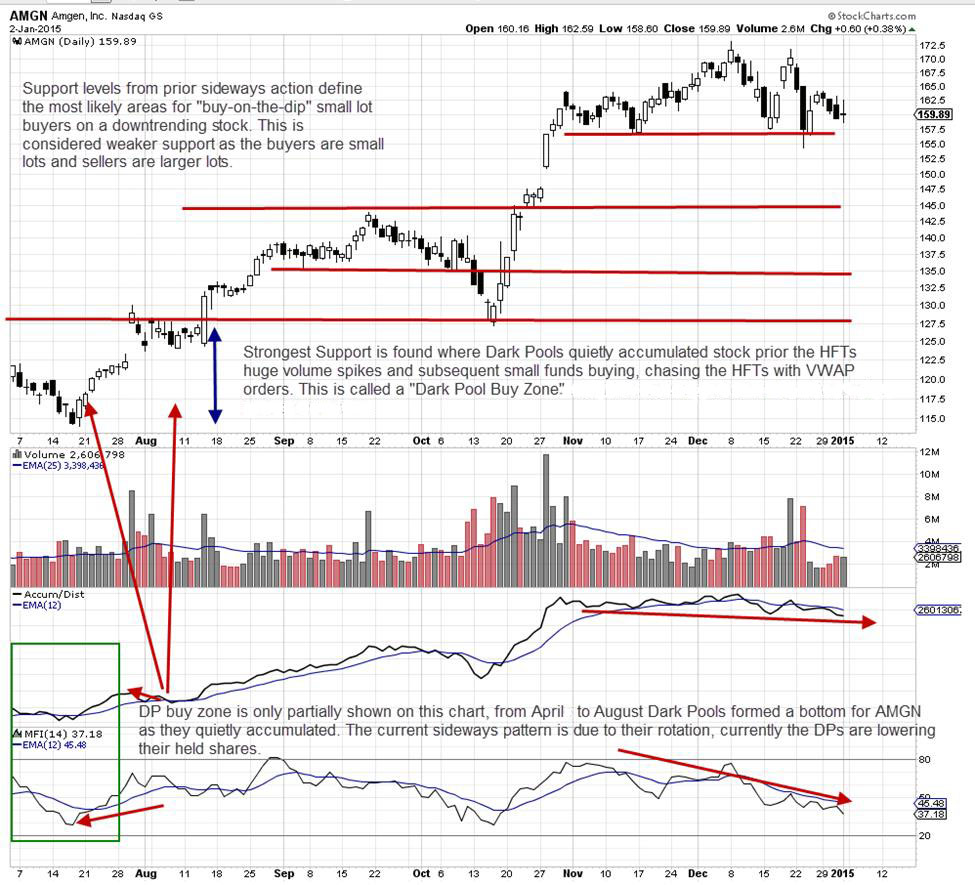
A chart example of how support levels are analyzed, and which Market Participant group formed each support level is provided below. Amgen, Inc. (NASDAQ:AMGN) is showing signs of weakness in its chart starting in November through to the current data on this chart. The black candles on down days are dominant, and larger with higher volume.
Each subsequent run up are smaller runs, which are called “Shrinking Candle” runs. The first signal of a potential topping action is when the short term runs shrink. The Dark Pools are quietly rotating to lower the quantity of shares they are holding in AMGN as the year comes to a close. They start early, weeks ahead of the year end. Their large lot selling is very precise and controlled in an attempt to not disturb the current trend. Unfortunately the more Dark Pools add the larger lot pressure, the weaker the upside becomes. Eventually the smaller lot buyers who have far less capital to invest run out of money to buy the stock, and the result is a base topping action.
HFTs move in on December 23, 2014 as they discover the Dark Pool rotation driving price down. Over the next few days odd lot investors and new uninformed investors buy into the stock, moving price up slightly on extremely low volume. The lower high on the white candle runs in December indicate that the sell side has taken control of price.
The MFI and Accum/Dist indicators as well as Volume, all confirm that Dark Pools were rotating during the past 2 months and that HFTs took control to establish the first large black candle. The first tier of support is therefore created by the smaller lot investor Market Participant Group, which are the odd lot investors and retail traders all buying into a topping formation without realizing it.
The question now for the sell short Swing trader is whether there is sufficient downside point gain potential for solid sell short profit. For now the stock is holding tenuously to the support provided by smaller lot Market Participants. Once this group ceases buying, the selling pressure will increase.
The second tier of support is the September platform which broke temporarily to the downside during that month, when selling pressure caused a short Shift of Sentiment™ downside run. The move down dropped the stock back into a “Dark Pool Buy Zone” and their automated orders quickly triggered. This was followed immediately by HFT orders triggering to drive the price up with momentum to the final sideways level.
The highs of September offer weak support as this Platform failed and weakened, during the September overall market dump. The lows of September start to enter the primary Dark Pool Buy Zone,” which formed the bottom from May – August of 2014. The strongest support level in a stock chart is always a “Dark Pool Buy Zone.”
Summary:
Once the stock breaks through the current topping action support lows, the next support is the September highs which are unlikely to hold up to any substantial selling momentum. However the September highs are a bounce area for short sellers to take profits. The stock could bounce there a bit higher if the uninformed investors and smaller funds decide to use an automated trigger “buy-on-the-dip” strategy. These strategies tend to trigger in the monthly high or monthly low areas.
The second area of strong support is the “Dark Pool Buy Zone” which is a range of price. This lower level can create speculative action upward, by the HFTs that trigger should they detect any Dark Pool giant lot activity.
By identifying each support level, which market participant created that level, and how each group will react to that price range the short term trader can quickly and easily calculate if there are sufficient points to gain on the downside for a good sell short run. As always, the sell side must constantly be aware of the pull of buyers and take profits ahead of any potential bounce area.
Trade Wisely,
Martha Stokes CMT
www.TechniTrader.com