
Monitoring purposes SPX: Closed short SPX on 12/10/14 at 2026.14= gain 2.37%. Short SPX 12/5/14 at 2075.37.
Monitoring purposes GOLD: Gold ETF GLD long at 173.59 on 9/21/11
Long Term Trend monitor purposes: Flat
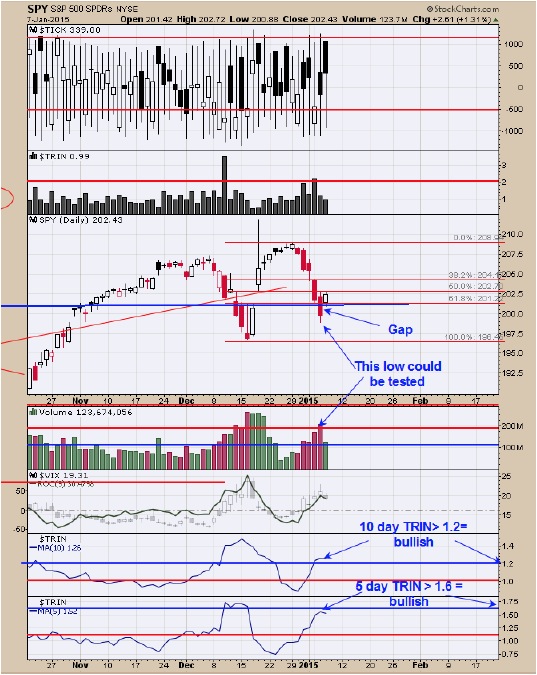
The week before option expiration week can produce a whipsaw or two and this is the week before option expiration week. The market rallied today but we don’t believe the uptrend has started (see page two). There could be backing and filling short term. Today’s rallied looked more like short covering than the beginning of an extended rally. Today’s rally tested yesterday’s high on about half the volume and suggests yesterday’s high has resistance. Also yesterday’s decline did not draw a any bullish candlestick pattern and also had high volume which suggests at some point, yesterday’s low will be tested. We have a cycle low start today and runs into Friday but could extend into early next week. Both the 5 and 10 TRINS are in bullish areas and suggests a low is near. Still looking for a bottom in this region. Next week is option expiration week which normally has a bullish bias.
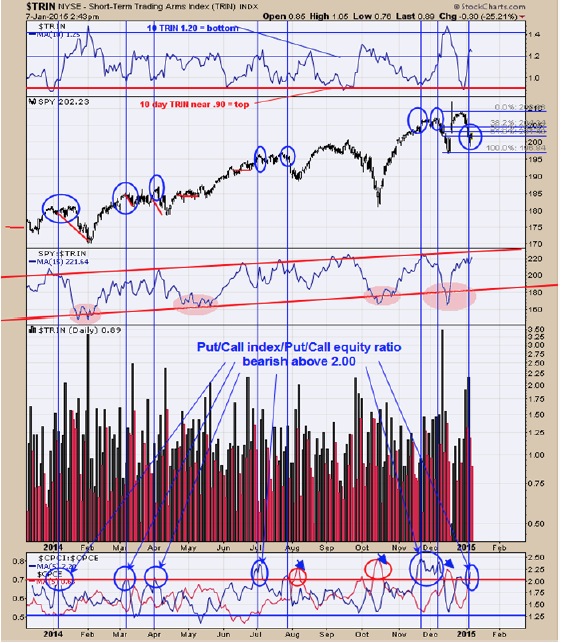
According to the CBOE index put/call/CBOE equity put/call ratio, no worthwhile bottom has formed yet. The bottom window is the “CBOE index put/call/CBOE equity put/call ratio” designated in blue. We have drawn blue vertical lines at the times when this ratio closed above 2.00 going back over a year. Each time this ratio was above 2.00 the SPY was at or near a high. The current reading on this ratio stands at 2.20. We don’t think the bottom process is complete for the SPY and at a minimum will test yesterday’s lows. We still expect option expiration week (next week) will have a bullish bias and will be looking for a bottom that may form in the next few days. Closed short SPX at 2026.14 for a gain of 2.37%; short on 12/5/14 at 2075.37.
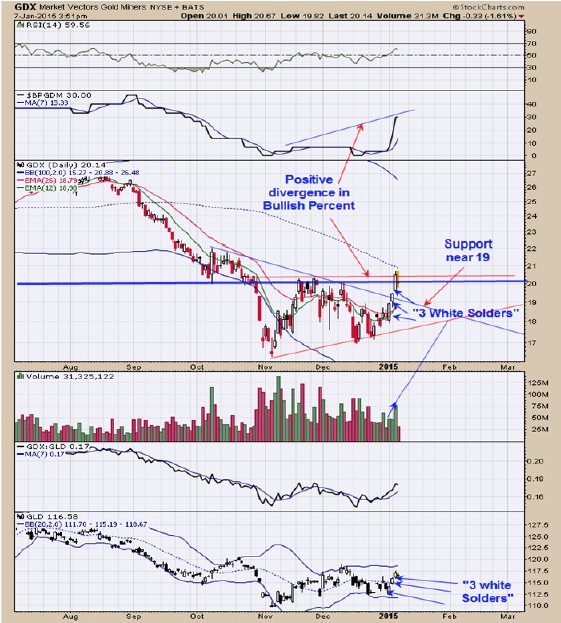
A bullish candlestick pattern called “Three White Solders” appeared both in GLD and GDX. This pattern shows up near bottoms in the market and predict an intermediate term advance is beginning. There can be short term pull backs after this pattern forms, but market should hold support near 19. The bullish Percent index is showing the most bullish divergence hit 30% stocks on buy signals and most of that strength came over the last three days. This buy signal could last several months. It is said, “If a market can’t hold below its previous lows it will attempt to take out the previous highs”. In the case for GDX it would give a target near 28. We are long GDX on 1/6/15 at 20.47.
Tim Ord,
Editor
www.ord-oracle.com