
Monitoring purposes SPX: Closed short SPX on 12/10/14 at 2026.14= gain 2.37%. Short SPX 12/5/14 at 2075.37.
Monitoring purposes GOLD: Gold ETF GLD long at 173.59 on 9/21/11
Long Term Trend monitor purposes: Flat
Timers Digest reported the Ord Oracle number 9 in performance for one year updated December 17.
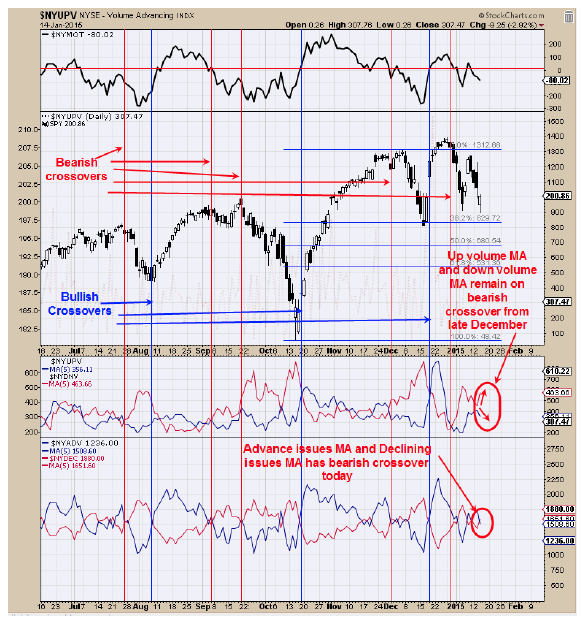
The bottom window is the advancing issues with a 5 period moving average and declining issues with 5 period moving average. The red and blue vertical lines show bullish and bearish crossovers on this indicator. A bearish crossover occurred today. Next window up is the Up volume with 5 period moving average and down volume with 5 period moving average. The red and blue vertical lines also show the bullish and bearish crossovers. Notice up and down volume increased separation today showing the up and down volume was weaker today than yesterday. Even though our downside target was a test of the January 6 low (today’s trading tested the January 6 low) we don’t have the confirmation for a buy signal here. We will see what tomorrows bring.
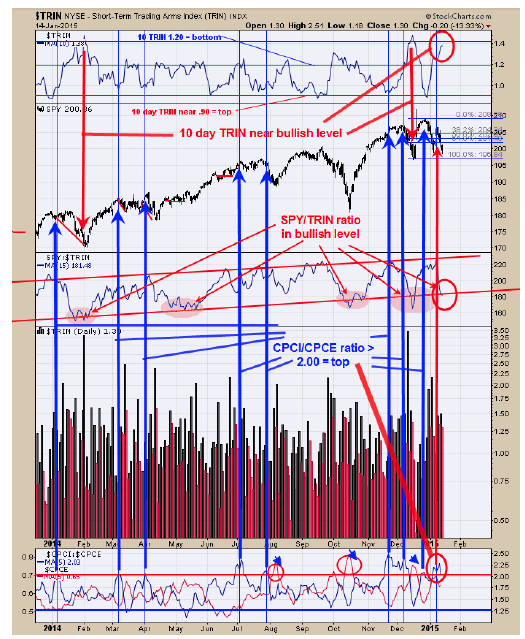
The CBOE index put/call (CPCI)/CBOE equity put/call ratio (CPCE) stands at 2.03 and a reading near where tops form in the market (noted in the bottom window designated in blue line.) We have drawn blue vertical lines at the times when this ratio closed above 2.00 going back over a year. Each time this ratio was above 2.00 the SPY was at or near a high. The top window is the 10 period moving average of the TRIN. Readings above 1.40 have come near bottoms and the current reading is 1.38 and near bullish territory. The window below the SPY chart is the SPY/TRIN ratio and readings at and below the red line are considered bullish and today’s trading reached this bullish level. We where expect option expiration week (this week) to have a bullish bias but we like to see the TRIN and Ticks reach extreme levels to signal this bottom and so far that has not developed. Also the CPCI/CPCE ratio still is setting at levels where market tops are common. We where expecting the SPY to test the January 6 low and that was accomplished today but we don’t have the confirmation to say this area is the bottom. Closed short SPX at 2026.14 for a gain of 2.37%; short on 12/5/14 at 2075.37.
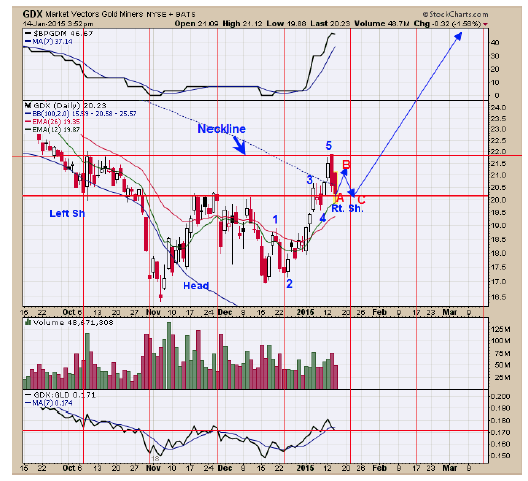
The bullish Percent index for the Gold Miners index jumped 40% over the last 2 weeks and shows this market is getting stronger. From the December low, an Elliott five count was completed at January 13 high. What may come next is an ABC corrective pattern. We have vertical lines drawn on the chart that represent cycles and the next cycle due in late next week and may be the times where the corrective ABC pattern may end and complete the “Right Shoulder” of this Head and Shoulders pattern we have talked about in the past. This potential Head and Shoulders bottom has an upside measured target near 28 which is also the July and August 2014 highs which is a resistance area. To help confirm this potential Head and Shoulders bottom, A “Sign of Strength” should be seen through the Neckline near 22 on GDX and something we will be watching form. It’s a bullish sign longer term when a five count up can be counted and that was accomplished from the December 15 low. We are long GDX on 1/6/15 at 0.47.
Tim Ord,
Editor
www.ord-oracle.com