Other Financial Markets Impact Stocks Unexpectedly
Relational Analysis™ Reveals Why
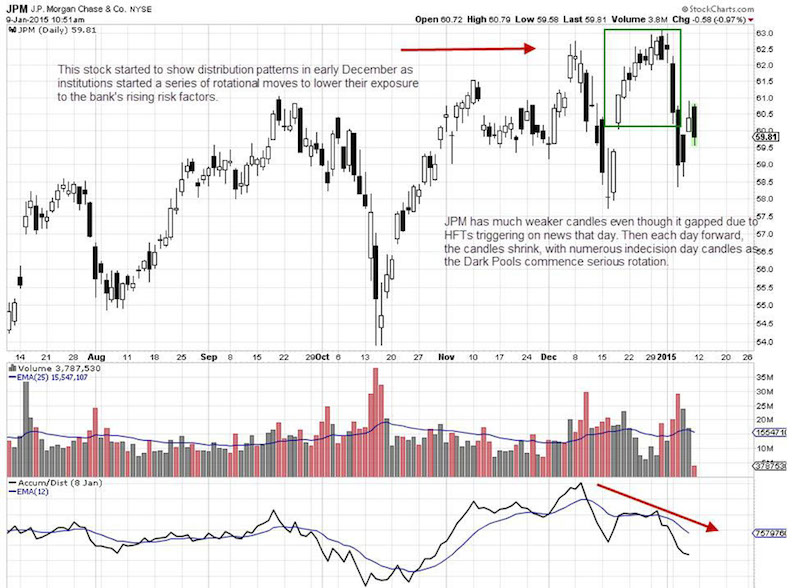
Why did J.P. Morgan Chase & Co. (NYSE:JPM) not rebound and rally when the Dow Index rallied this past week? Whenever a stock diverges from the index it is on especially during extreme sudden selling or sudden rallies, retail traders need to understand why the divergence occurred so that they can prepare for the near term price action. Relational Analysis™ reveals the “Why” behind the Price and Volume action in the stock chart.
As the Dow moved up strongly on Wednesday and Thursday with triple digit gain days, JPM which is one of the more important components continued to show strong sell side bias in its Candlesticks, Accum/Dist indicator, and in Volume. This is a divergence pattern that warns more is going on with the company than may first be obvious. The divergence is subtle but it is undeniable.
Banks had been investing heavily in commodity stocks, in particular oil stocks during the recession. This is normally not permitted by the government, but an allowance was made to help the banks during that period of time. Some banks still have a vested interest in oil and other commodities. As the commodity oil plummeted concerned institutional investors started lowering their risk by quietly rotating out of the stock, to mitigate their risk and exposure should oil prices remain low.
Rotation has a very specific footprint that can take some time to learn to read properly. It is far more subtle then a full blown distribution pattern. It tends to last much longer and at times can drag down the stock price, even though the distribution is intended not to alter the upside trend as the giant funds sell out.
Rotation also rarely disturbs the current trend, which is often under control at highs by smaller lot investors and retail traders who prefer big cap stocks. Rotation can however slowly erode the upward momentum. If there are many institutions rotating at the same time, then it can begin to weaken the Candlestick patterns as occurred in the chart above during the December rallies.
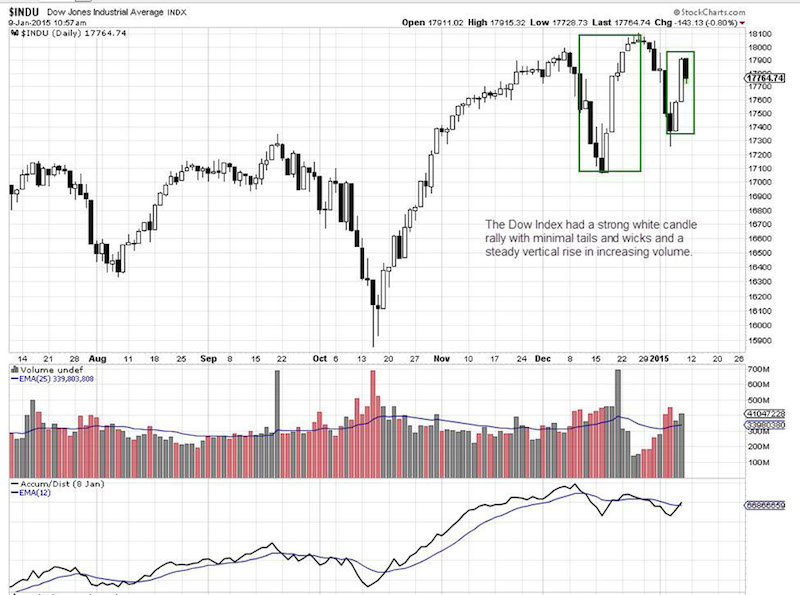
The mid-December rally upward for JPM is significantly weaker both in Volume and the Candlesticks, when compared to the Dow Jones Industrial Average (INDEX:$INDU) chart below. It had strong Candlesticks moving up to the Trading Range highs, before turning at the range high.