
Monitoring purposes SPX: Closed short SPX on 12/10/14 at 2026.14= gain 2.37%. Short SPX 12/5/14 at 2075.37.
Monitoring purposes GOLD: Gold ETF GLD long at 173.59 on 9/21/11
Timers Digest reported the Ord Oracle number 9 in performance for one year updated December 17.
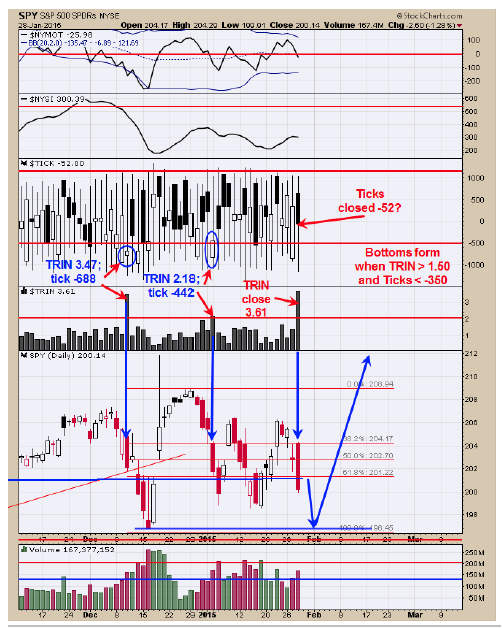
A bottom in the market is expected on the same day to as late as two days later, when the TRIN closes above 1.50 and Ticks close below -350 the same day. Today the TRIN did produce a panic reading of 3.61 but the Tick closed at -52 and not at the panic levels and suggests the trend is still down. When the TRIN does reach panic levels the tick usually follow with in a couple of days and suggests a bottom is not far off. The December 16 low near 197 is still a possible target for the next bottom. Still neutral for now.
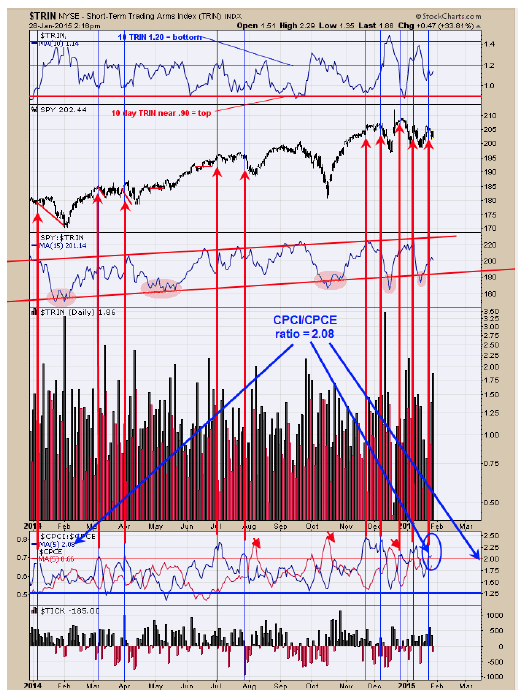
The five day moving average of the CBOE index put/call (CPCI); equity put/call (CPCE); CPCI/CPCE ratio stands at 2.08 (up from 2.02 yesterday) and a reading near where tops form in the market. We keep showing this chart because it appears to have relevance in current timeframe. Over the past year when this ratio was above 2.00 the SPY was at or near a high. A “Selling Climax” occurred on December 16 (low near 197 on the SPY) that was never tested and most “Selling Climaxes” are tested at some point and leaves that door open for that low to be tested. We would like to see the TRIN and TICK closes to reach an extreme and put in a solid bottom and the current pull back may produce that setup.
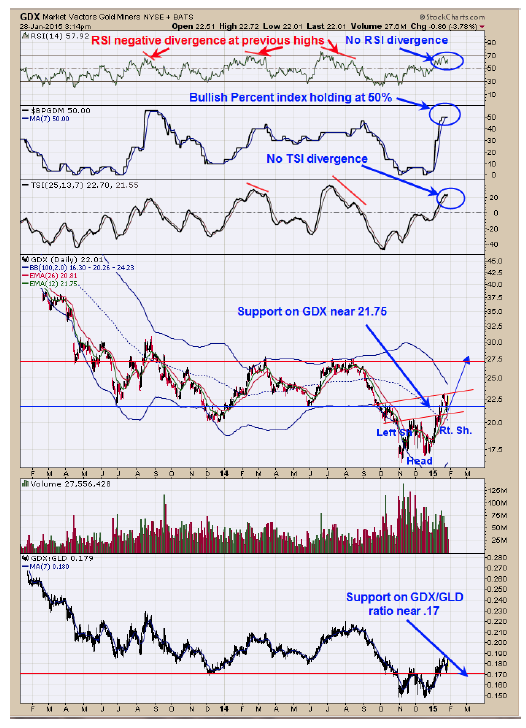
The top window is the RSI. Previous minor highs in GDX showed a bearish divergence in the RSI and so far the current RSI reading shows no divergence and a bullish sign. The second window from the top is the Bullish Percent index for the Gold Miners. The Bullish Percent index appears to be holding the 50% level and a bullish sign. GDX broke through the previous lows near 21.75 and now 21.75 should be support and market is near this support level. The bottom window is the GDX/GLD ratio. It broke through .17 resistances in early January and now has support near .17. The pattern that appears to be forming on GDX is a Head and Shoulders bottom where the Head is the November and December 2014 lows. The “Right Shoulder” appears to be forming now. This potential Head and Shoulders bottom has an upside target near 27.50 which is also the previous highs. We are long GDX on 1/6/15 at 20.47.
- Tim Ord
Editor
www.ord-oracle.com/