
Shrinking Candlesticks and Falling Volume
One of the more important Spatial Pattern Recognition Skills™ that technical traders need to be able to quickly identify, especially during a sideways price action is the negative divergence between Price and Volume. This is often the earliest warning signal technical traders can use to prepare ahead of time for a potential sudden collapse of price as High Frequency Traders HFTs suddenly move in to sell a stock short.
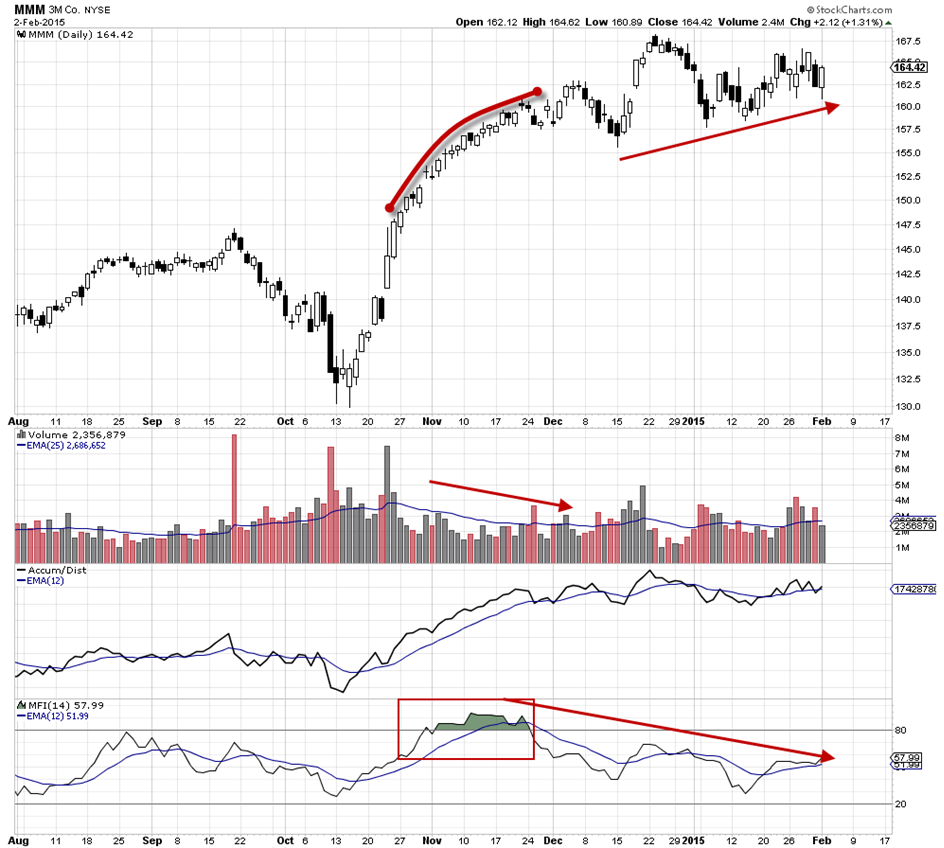
The candlestick chart example below has more than one negative divergence occurring at this time. First warning was the rounding of the uptrend price action. This was due to the negative divergence between Price moving up as Volume declined, and fell well below the average for this stock. The second divergence is the current sideways pattern that is moving up slightly while MFI is falling down. This is a severe negative divergence from price. The combination of both on this chart is a warning to those considering buying the stock for upside short term profits.
A Shift of Sentiment™ has occurred on the stock chart. This is due to quiet, persistent rotation by the giant institutions. They slowly reduced their number of held shares, and this increasingly put more pressure on the downside. Smaller lot buyers buying in late are insufficient in numbers to maintain the uptrend, as the large lots sell into the upside buying of the smaller lot investors or technical traders.
Should the rotation continue or if more institutions decide to also reduce their held shares, this will become known to the HFTs and the risk of a sudden HFTs sheer cliff collapse increases. This is pattern that often forms when a company fundamentals are beginning to show signs of weakness or when their business cycle is reaching its final peak.
The rotation began back in October as small lot investors chased the HFTs moving the stock out of the lows of the fall correction. The size of the candles, the rounding pattern, and the declining Volume are all indicative of smaller lot investors and smaller funds managers buying into weakness. This footprint is easily recognizable on the stock chart.
Summary:
Topping patterns are often missed by technical traders, if they are not looking for the negative divergences between the Price candlesticks and Volume indicators. Every time a stock shifts into a sideways pattern especially with shrinking candles and falling Volume, a technical trader should also look for negative divergences in the other Volume indicators they study.
Trade Wisely,
Martha Stokes CMT
www.TechniTrader.com
info@technitrader.com