
After many months of low activity, markets finally got going mid last year. Was it the anticipation of an end to US QE, war in Ukraine, the Saudis dumping oil, Abenomics, the SNB’s surprise move, GREXIT or anticipation of ECB’s own QE? It was probably a bit of all. For sure, the last 6 months have seen large directional moves in many asset classes. Over the last couple of weeks, some of these trends have started to correct. We will take this opportunity to use our FinGraphs service to monitor two of these countertrend moves (EUR/USD and Brent Oil). We will also look at two more important consolidation/correction periods, namely on the ones at play on Gold and the S&P500.
EUR/USD on an Investor’s View: “Potential Intermediate bottom in a Downtrend”
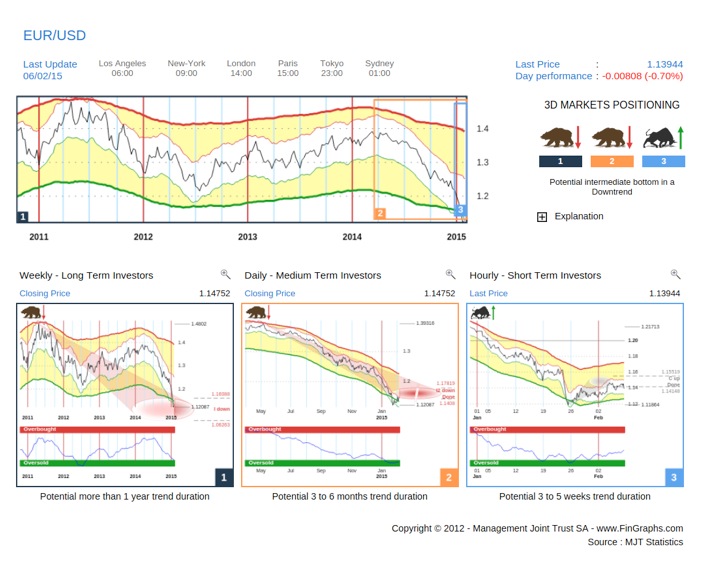
In a way, the automatic 3D Markets Positioning message says it all (“Potential intermediate bottom in a downtrend”). The Weekly (left hand chart) and Daily (middle chart) are still negative and the current move on the Hourly (right-hand chart) is only a correction (grey price projection). To create a more meaningful countertrend, EUR/USD would now need to turn Impulsive (“I up”) on the Hourly. This would imply moving above circa 1.1550 (the upper end of the Hourly corrective targets up). As this is not yet the case, the Weekly and Daily downtrends still prevail.
Oil Brent on an Investor’s View: “Potential Intermediate bottom in a Downtrend”
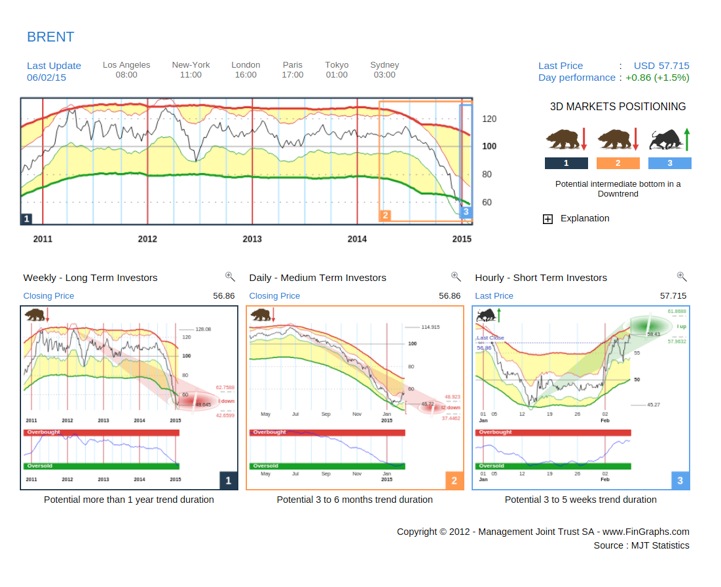
A similar situation on Brent Oil, although the Hourly (right-hand chart) has seen more strength than EUR/USD. Indeed, it is approaching impulsive targets up. These levels, slightly above $60/barrel did offer some support back in December and could now act as resistance. Moving above this resistance and turning corrective up (“C up”) on the Daily (middle chart) could justify a more sustainable countertrend move. However, until it eventually happens, we would consider the current move up on our Hourly charts to have potentially reached exhaustion.
GOLD on an Investor’s View: “Potential resume Downtrend in a pullback period”
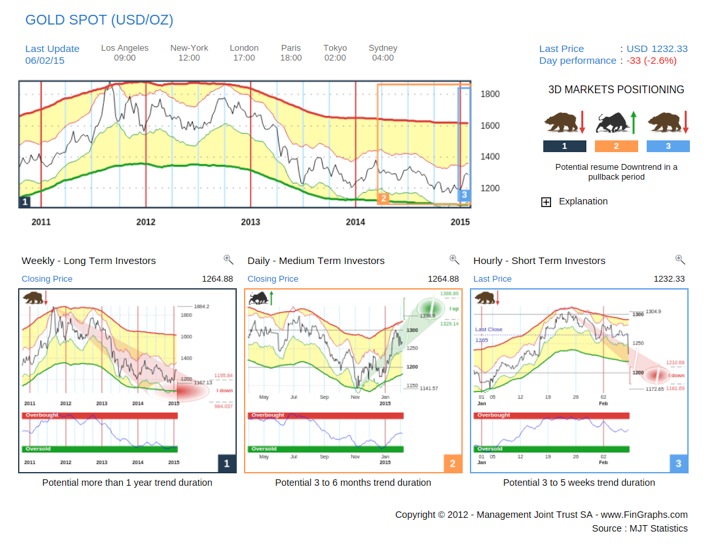
The Daily uptrend on Gold has taken a strong blow today. As Non-Farm Payrolls came in better than expected, Gold dived below its Hourly (right-hand chart) corrective targets down. Hence, this Hourly move is now Impulsive down and positioned against the Daily (middle chart) uptrend. It is in the same direction of the longer term Weekly downtrend (left hand chart) and could potentially lead us back to the low 1’200s.
To illustrate this breakdown, we include below the same Investor’s View taken earlier this morning in Europe:
Gold on an Investor’s View before today’s Hourly downside breakout:
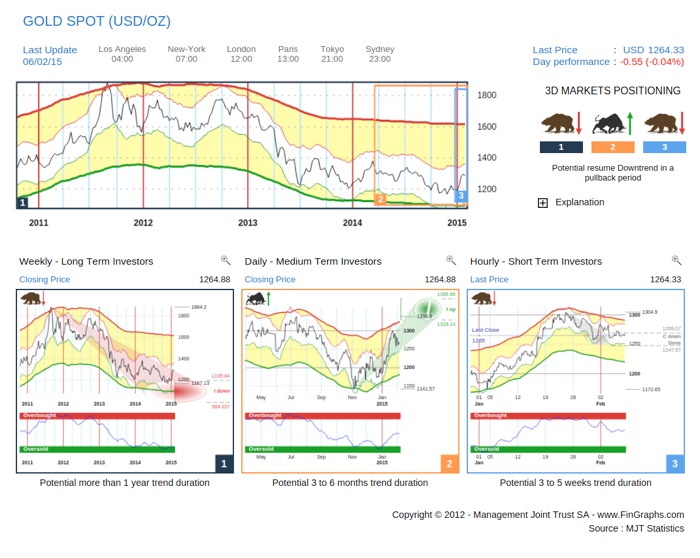
Corrective targets (in grey) provide guidance as to where countertrend moves should find support or resistance. As mentioned last Saturday during our webinar with Chip Andersen, they can also serve as levels where to position trailing stops vs a trend of the next longer degree (i.e. just below the target zone in a correction down, just above it in a correction up). Indeed, once price breaks through such corrective targets, the trend turns impulsive (red in a downtrend, green in an uptrend). Such impulsive moves often have the strength to jeopardize an opposite trend of the next longer degree. For example, an Hourly correction down that turns impulsive does cast doubt over an ongoing Daily uptrend. This is what happened on Gold this afternoon, as price moved below 1’247-1’248 into impulsive territory on our Hourly (right-hand) chart. The intermediate uptrend on Gold on the Daily (middle) chart is now in danger: it wasn’t strong enough to turn the longer term Weekly downtrend (left hand chart) and it is now challenged by a shorter term Hourly (right hand chart) impulsive move down. In this context, the position on Gold is now at best neutral. One would need to turn to the shorter term Trader’s View (a combination of a 60 minutes, 15 minutes and 4 minutes chart) to seek short term direction.
S&P500 on an Investor’s View: “Potential resume Uptrend in a consolidation period”
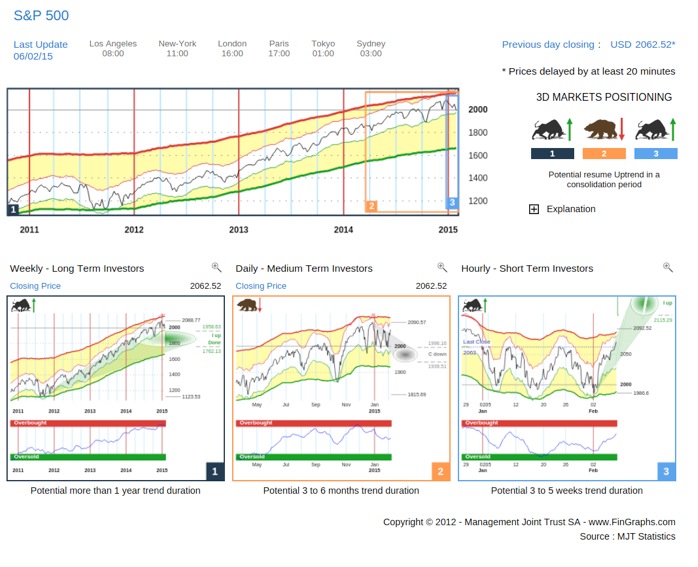
Similarly to Gold, the S&P500 broke out from its Hourly (right-hand chart) corrective targets. It just did so in the opposite direction (upside break-out on the S&P500, downside breakout on GOLD). Similarly to Gold, we also include the chart below before the breakout. The corrective targets up are coloured in grey on this Hourly (right hand) chart.
S&P500 on an Investor’s View before today’s Hourly upside breakout:
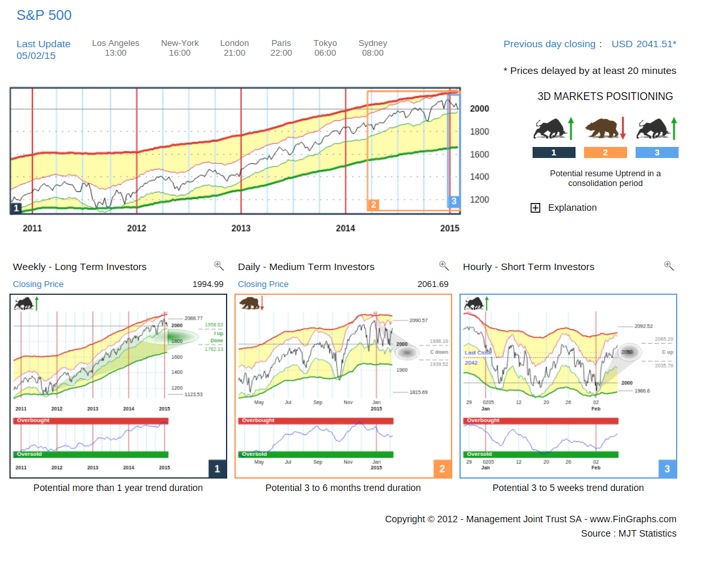
Looking ahead, the Weekly (left hand chart) is still in an uptrend, although it is showing some signs of exhaustion (“I up done”). The Daily (middle chart) is in a consolidation down and may have more work to do (more price potential down, more time left). Hence, the upside breakout above former January tops on the Hourly (right hand chart) is indeed promising, but less than certain for now. We will focus on the shorter term Trader’s View early next week to monitor a potential pull-back. Ideally, we would want to hold above corrective targets down on the 15min chart (not shown).
FinGraphs’ “Market in 3D” is about understanding how trends interplay. It may appear more comfortable when markets are directional and trends are aligned. Yet, when these desynch, it does give you the instruments to position yourself accordingly: it differentiates between impulsive and corrective trends and, by doing so, will highlight the levels you need to watch to position yourself in countertrend moves. Finally, more active traders can also switch to the shorter term Trader’s View to monitor breakouts against the prevailing medium and longer term trends.
Train and test these skills using our HistoView functionality. It is available above each chart and allows you to scroll back in time or view a chart at any chosen date in the past.
For more information on our methodology click here (http://www.fingraphs.com/#couponid-STKCHARTS14) and then view the Introduction slide-show and visit the ‘User Guide’ section on our website. Clicking that link also qualifies you for a 7 day demo and a 10% discount on our services if you choose to subscribe.
Have a great weekend, J-F Owczarczak (@fingraphs)