
Rationales & Targets
The extent of overvaluation now borders on the surreal. As Jesse Felder recently showed on his blog (see http://bit.ly/1FtTxjR), by several additional measures we have not previously mentioned, the U.S. stock market is at its most expensive point in at least 55 years. The fascination with the possibility of a new record high for the Nasdaq Composite Index has captured the financial media, repeated every day with near child like anticipation. The old print high was 5048 on March 9, 2000. However, inflation always confiscates wealth over time and to reach a new inflation adjusted peak, Nasdaq would have to surge another 36.6% to 6893.
We were correct about the banks holding support and rallying if oil reversed and Crude promptly rallied from $48 to over $61. Now what? $62-$63 is beginning to shape up as resistance, so time will tell. Currently, the only major bank chart that remains dicey is BAC and it looks horrible after an analyst downgrade. Friday’s disappointing revision in 4Q’14 GDP is relevant. There is no way things are as good as the bulls insist. We’d be shocked if Q1’15 comes in as high as 2% and we believe a slowdown, possibly a recession, is in progress. Clearly, the persistent snows this winter have impacted the economy and we continue to suffer through one of the greatest phases of malinvestment the country has ever experienced as corporations buy their own stock rather than invest in the future. Despite what you hear CNBC’s cheerleaders, the background is not at all bullish.
"Interconnectedness"
The U.S. Office of Financial Research (http://financialresearch.gov/) recently launched its new website and promptly offered a risk analysis profile for major bank holding companies (see http://bit.ly/1E5MBc8). The report confirms our views of the very largest banks and their “Interconnectedness,” defined as “the failure of a bank to meet payment obligations to other banks [which] can accelerate the spread of a financial system shock if the bank is highly interconnected.” The near cataclysm back in 2007 wasn’t all about Bear Stearns and Lehman, it was about their interconnectedness with all the other major players. Unfortunately, there are now so many derivative contracts in play that it is likely impossible to fairly gauge how risks are balanced. As of the third quarter 2014, the top 25 bank holding companies had $304 trillion in notional values in their derivative portfolios. For many years, we somewhat arbitrarily focused on the notion that 2% of outstanding notional values were a worst case scenario for risk to the financial system. In 1998, when Long Term Capital Management single handedly brought the system to the brink, total notional values were $32.9 trillion, only one-ninth what they are now. However, according to an article in Institutional Investor magazine in April 1999, LTCM was tied into a daisy chain of $2 trillion in interconnectedness, 6% of all notional values. Thus, our 2% risk potential theory is likely a conservative view. Risk potential of even 2% equates to over $6 trillion in losses, an amount equal to one-quarter of the entire market capitalization of the U.S. and one-third of our GDP. The events that have preceded us, such as the Crash of ’87, LTCM in 1998 and the mortgage bust of 2008 offer solid proof that significant derivative events are not just possible, they are inevitable. Featured at center, a chart from the publication, noting “total exposures are considerably more than assets.” (emphasis ours).
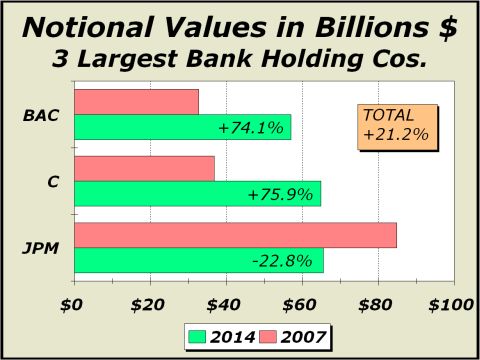
How would the 2007-2008 financial collapse have played out if we had known in advance that banks would be bailed out and paid for taking incredibly stupid risks? Would there have even been a housing mania? Given this dangerous precedent and the apparent fact that the biggest banks are still too big to fail, haven’t we ensured a repeat scenario somewhere down the road?! Isn’t it obvious that greed must still play a huge role in the operation of banks? Isn’t is patently obvious that as derivative portfolios continue to grow, risk taking will be at least as pervasive as it was in 2007?! Below left, the three major players shown currently account for $187.3 trillion in notional values, up 21.2% from their average level in 2007. Maybe we can be somewhat more confident since the total for JPMorgan Chase (JPM) is down 22.8% from 2007 but what about Citigroup (C) and Bank of America (BAC), both up roughly 75%? If they were all too big to fail in 2008, aren’t they way too big to fail now? And what about Goldman Sachs (GS) and Morgan Stanley (MS)? Both weren’t even in the top 25 in 2007 but are now third and fifth largest with derivative portfolios of $58.2 trillion and $43.9 trillion respectively. For the full list of the 25 largest bank holding companies, notional values have surged 85.7% from $163.8 trillion in 2007 to $304.2 trillion last year. “Interconnectedness” nearly collapsed the entire financial system seven years ago. Clearly, it is on track to do the same today.
For more information, please contact us:
Alan M. Newman, Editor, Crosscurrents
www.cross-currents.net