Rationales & Targets
It is generally acknowledged that bull markets thrive in a low volatility environment. The very worst type of action is an expansion in volatility, even when it takes place on the upside, since rapid movement equates to discomfort. Volatility makes decisions more difficult. Volatility can be scary. The overall effect is players tend to go to the sidelines which in turn, decreases liquidity, which in turn increases volatility. It’s a cycle and often how a bull market turns into a bear. From near the bottom in 2003 to near the top in 2007, the Dow went 992 trading sessions before there was a 3% intraday range between the high and low. As the character of the market changed, the pace of 3% days of movement increased. That particular bull phase of low volatility was quite long and at present, we are riding a similarly long lived streak of 835 days in which the Dow has not had any 3% ranged high to low days. We expect this environment to soon give way to an emphatic phase of volatility, indicating a new bear market is imminent. Suffice it to say, several indications of this possibility have surfaced in other volatility measurements and we will spend some time in that analysis in our next issue.
For now, we are using our support levels listed at right as our guide to what comes next. We are not looking for an immediate expansion in volatility but we believe the news background is very sensitive at this point. The stock market is as vulnerable now as it was in October 2007.
Insider Activity
[This is just an excerpt from the March 30th issue - contact us if you wish to see the entire article]
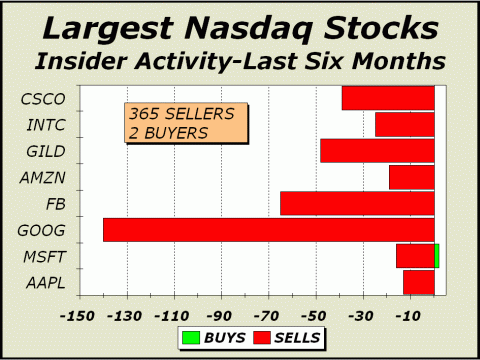
We haven’t updated our insider activity report for the largest Nasdaq issues in quite awhile and we’ll rectify that shortcoming right now. As you might have expected, not much has changed. Even while corporate treasurers are buying back their own shares like the sky is the limit, insiders are selling in droves like there is no tomorrow. Our eight constituent issues represent $2.33 trillion in market capitalization, nearly 10% of the entire capitalization of the U.S. stock market and 41.4% of the top 100 Nasdaq companies, otherwise known as the QQQ Trust. At bottom right, over the last six months, there were 365 sales. The two lone buys were at Microsoft (MSFT). For the rest of our group, there were zero buyers and 349 sales of more than 20 million shares. Truth be told, the stats resemble many of our previous look backs. What has changed is the velocity of share buybacks by corporate treasuries over the last year. In the first three quarters of last year, buybacks rose 27%, to $567.2 billion and Apple (AAPL) alone spent $17 billion buying its own stock.
Of course, the effect of the buybacks tends to lift earnings, which in turn tends to lift share prices, which in turn makes generous stock options grants that much more attractive. Is it any wonder that we see insiders selling in droves? What troubles us is how this dichotomy is tolerated. If the shares have sufficient value to be bought by corporate treasurers, why is it that insiders are selling the very same shares in droves? Isn’t is patently obvious how the corporate buyback strategy plays into the hands of insiders?! We can’t imagine that corporate treasurers are seeing value. Consider the price to sales (P/S) chart on page one of the February 28th issue, showing the highest level for the S&P 500 since the tech mania, more than two standard deviations from the norm and well more than double the median from 1964-2014. The P/S for our group is 5.53, more than six times the 1964-2014 median, and well into the land of the bizarre.
As we have previously noted, analysts are forever upbeat on every sector. Being a bear on Wall Street carries zero benefits. No one wants to hear the bear case, no one wants to face the bear case. Everyone loves a bull. Thus, the “buy” and “strong buy” segments for analysts are always in the majority. Apparently, no matter where we are in the cycle, even days away from a bear market, roughly two-thirds of analysts are in the buy camp. The situation has become so bizarre that the “strong sell” designation was dropped entirely from the vocabulary of analysts. The designation just does not exist anymore. No matter how bad a company’s prospects are, it can never be considered a strong sell ever again.
The anti-bear case appears to be at its most emphatic when we examine how analysts rate the biotech industry, now in the midst of one of the greatest manias we have ever witnessed. The Nasdaq Biotechnology Index Fund (IBB) has soared 556% from the November 2008 low and 81% in only the last 11 months. Surely, some biotechs must be overvalued at this point and in danger of making a significant turn to the downside? Well, analysts clearly don’t think so. There are zero sells versus 68.2% in the buy or strong buy camps. In fact, of 239 opinions rendered, only three see any kind of “underperformance” at all. Considering that or group has an average P/E ratio of 54.6, we see the bullishness of analysts as more than just a bit ebullient, more like manic. The group are collectively valued at $675.8 billion at today’s prices. If like us, you thought a price/sales ratio of 2 for the S&P 500 was way too high, then you probably thought the P/S ratio of 5.53 for our QQQ stocks was beyond the pale. What would you think if we were to tell you that the P/S ratio for our biotech group is 24.7?! We wonder. As far as we are concerned, this is additional evidence of the ongoing mania for U.S. stocks.

For more information, please contact us:
Alan M. Newman, Editor, Crosscurrents
www.cross-currents.net
