
Hey Dave, “Were the new highs in March really new highs?” To answer this question, I will feature charts showing the real (inflation adjusted) value of the indexes in comparison to the actual value.
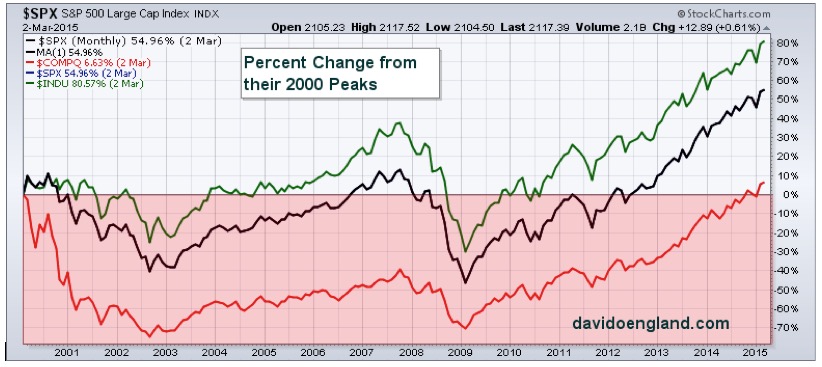
Here are percent changes from their 2000 highs; DOW 80.57 percent, S&P 500 54.96 percent, NASDAQ 6.63 percent. These are the numbers you see when looking at a performance chart. Unfortunately, since these are not adjusted for inflation, these numbers do not represent their true value over time.
New market highs are not market tops until profit taking occurs. Currently, I am excited to see investors with more green in their portfolio balances. After getting pummeled in 2000 and 2008, many investors needed a multiyear Bull Run just to get back to even. Ask yourself a simple question, “Why did you invest hard earned money in the market in the first place?” I am certain most investors did not enter the market just to break even.
We are told by Wall Street to invest for the long run and not to worry when the market drops/sells off because the market “will always return.” Look at the chart from Doug Short (dshort.com) and you will see that this may not be true, especially when the major indexes are adjusted for inflation.
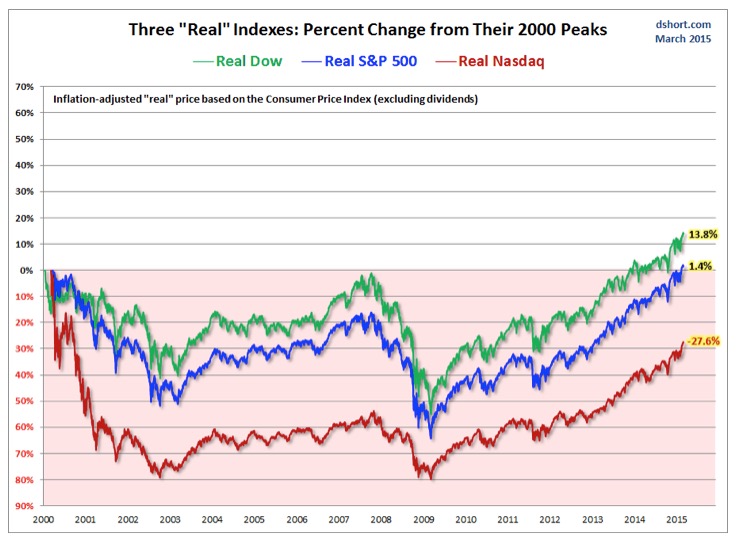
Earlier this year (2015) the indexes made new all-time highs. This is a true statement with the DOW, S&P 500 and NASDAQ when using their actual values. This chart shows the “Real” percent changes from their 2000 peaks, the inflation-adjusted “real” prices based on the CPI (excluding dividends). When we examine the “real value”, the returns; Dow Industrials (13.8 percent), S&P 500 (13.8 percent) and NASDAQ (-27.6 percent).
The bottom line-not everything comes back and long-term buy and hold investment thinking is far from perfect. For instance, what if you had needed your retirement funds in 2003 or 2009 — how would that long term strategy have worked for you? Do you want to count on luck for your financial future?
We see the major indexes made new highs in March 2015 but my question back to you is, “How did these new highs affect your portfolio balance?” A new market high is meaningless unless you locked in your gains. If you did not, then you saw the effects on your portfolio balance when the market bottomed in 2003 and also in 2009. Of course, you did not lose anything at these market bottoms if you did not sell. It goes both ways.
Wall Street makes their money with us being in the market. We make our money with what we own and when. I hope this analysis helps to answer your question. If you would like to sign up for my newsletter or research previous columns, go to my website davidoengland.com.
Plan your work, work your plan and learn to share your harvest!
David O England
This column is presented for educational purposes only and is not intended as financial advice. If you have a question, contact David England at thetraderseye@gmail.com.