
Downside Action In The Automated Stock Market
Recently the news media for the retail side of the market stated that the correction the market was experiencing during that week was caused by “investors reaction to the dollar value rising and the risk of the Feds raising interest rates.”
Although this statement appears to be factual on the surface, technical traders who have learned to identify Dark Pool rotation, distribution, and accumulation patterns were well ahead of that news. They were totally prepared for a correction as the Dark Pool rotation patterns that had started in December and continued in January and February, were the leading indications that a correction was already a risk factor.
To understand downside action in the automated marketplace it is imperative that technical traders not only understand new technical patterns showing up on charts, but also the trigger mechanisms firing off without human intervention that create the selling which can often be a sheer cliff huge gain run for selling short.
The stock chart example below of Unitedhealth Group, Inc. (NYSE: UNH) shows rotation patterns of the Dark Pools starting in late November.
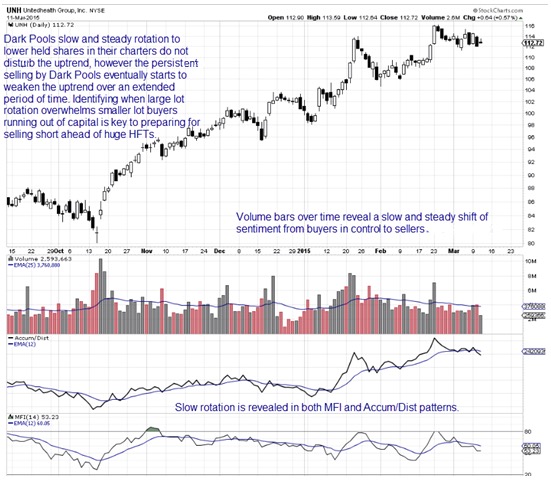
Keep in mind that Dark Pools are the giant funds with a typical size order of 100,000 to 500,000 share lots at one time. They control an average of 70% of the total outstanding shares of all of the fortune 500 companies, this is an average total. They control 90% of small cap outstanding shares. What they do alters trends eventually, even with the great care they take to not disturb price or trend while they buy or sell.
Stocks tend to trend upward during rotation so often those technical traders using only price and time indicators fail to see the rotation patterns that do not disturb trend, but will eventually lead to rising risk of a topping formation and High Frequency Trader HFT triggered selling.
Rotation actually is the earliest signs of a stock that will first encounter speculative runs, even while Dark Pool giants slowly lower their held shares for that stock. The buyers are smaller funds, HFTs, smaller lot investors, and retail traders. As these groups who all have limited capital resources run out of money to invest, the rotation by the Dark Pools begins to show up on the technical patterns that are used by professional independent and proprietary desk professional traders. Professionals then turn first to taking profits, ahead of any HFT activity.
The increase in selling orders from both Dark Pools rotation and by professional traders awakens the HFT sell side volume algorithm, which triggers whenever there is a subtle but distinct rise in sell orders. HFT computers then start a series of sell short orders, and this creates more professional trader activity as the human traders also begin to sell short. This then triggers stop losses, particularly those set at percentages.
With the triggering of major percentage level stop losses the sell side volume increases, triggering more HFT selling short with Pro traders typically riding the downside runs. Now Volume Weighted Average Price VWAP smaller fund orders to sell if volume increases to the downside begin to trigger. This triggers more selling by HFTs as the computer algorithm increases the speed and number of sell short orders in response to the VWAP selling. This takes out intermediate term stops, fueling more VWAP, more HFT, and adding impetus to the selling.
As the stock collapses, retail brokers are often advising their clients to “buy on the dip.” This creates a resting day or pauses in the downtrend, or a bounce if the smaller lot investors have sufficient numbers. However it does not cause a reversal rally pattern. That is caused by Professional traders seeing a low risk entry opportunity, who start the cycle all over again by anticipating the news, HFTs gaps, and huge runs.
Summary
The sell side action is far more complex than most technical and retail traders comprehend. It is not just about a temporary condition such as the dollar rising or chatter about interest rates. Corrections begin many weeks ahead of the final peaks and highs of a stock. Learning to identify these patterns before a correction, gives technical traders the ability to be ready ahead of time for selling short and higher profits.
Trade Wisely,
Martha Stokes CMT
www.TechniTrader.com