
Candlestick Price Action By Market Participants
As a retail trader improves their Spatial Pattern Recognition Skills™ they are able to begin to not only recognize certain candlestick patterns as taught in the traditional Japanese Candlestick Books, but are also able to go far beyond those basics of price analysis to interpret which Market Participants were controlling price at that time.
The dominant Market Participant Groups are High Frequency Traders HFTs, Dark Pools, giant lot institutions and Professional traders both proprietary desk and independents. Each group leaves a distinct footprint on the chart. Retail traders need to learn to these footprints, to avoid whipsaw action as well as accidentally trading against these dominant forces of the market.
The NVIDIA Corp. (NASDAQ: NVDA) is a fine example showing the price pattern of each one of these three groups in one stock chart.
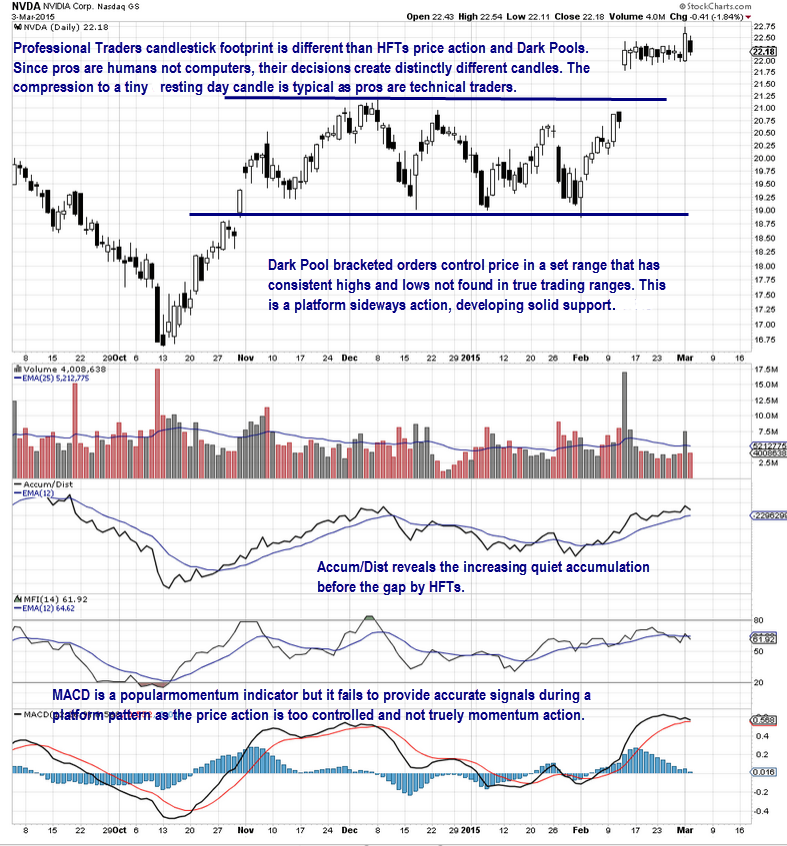
HFTs create huge gaps, long candles and high volume. Dark Pools contain their buying into a tight sideways pattern called a “Platform” which is wider than a consolidation, but also narrower than a Trading Range and far more consistent.
Platform patterns are relatively new, and have become a common sideways pattern that many retail and professional traders mistake for a Trading Range. Often Swing traders attempt to swing the narrower price action only to get whipsawed out of the trade at a small loss. Platforms are best used for Position Trading. Gaps are the most common conclusion to the Platform which can occur after a downside or upside run within the Platform range.
Professional traders are technical traders, with candle patterns that reveal their concentration on technical patterns and their ability to enter stocks with excellent execution. This Market Participant Group tries to enter with or soon after the Dark Pools reveal their activity. They often tighten price action to a resting day pattern, before the smaller funds and HFTs move price.
Unfortunately the most popular indicator that retail traders use which is MACD, fails or gives false signals during Platform phases and often is unable to keep up with the tightly compacted price of the Professional traders. The Accum/Dist indicator reveals Dark Pools and volume are critical to study as well. The inside day candle after the white breakout candle, lacks sufficient volume for a reversal pattern.
The following day volume surges and during premarket hours, NVDA on 3/4/15 shows a huge lot long white candle at 8:01am before the US exchanges are open. This confirms that the inside day was merely profit taking.
Inside day candles are the realm of Professional traders, who often confuse retail traders not trained in Western Candlestick patterns and formations. Inside days are unreliable in terms of reversal patterns in the new market structure where 80% of all orders are fully automated whether they are HFTS, Dark Pools, Professional traders, or other institutional side order flow.
Trade Wisely,
Martha Stokes CMT
www.TechniTrader.com
info@technitrader.com