
Since the end of its correction up, a year ago in March 2014, EUR/USD has lost circa 25%. Although this move may legitimately reflect different growth perspectives between the US and the Eurozone and resulting divergences in central bank policy, the scope and speed of EUR/USD’s descent is nevertheless exceptional. Let’s not forget that we’re comparing the largest with second largest currency block in the world.
In our previous contributions, during the 4th Quarter 2014 and earlier this year, we have repeatedly reiterated our bullishness on the Dollar and consequent bearishness on EUR/USD. Longer term, the scope of the move did not come as a surprise: the downside targets on our Weekly chart have been pointing to below 1.10 since last summer. The speed and linearity of the downfall is however more unexpected. In fact, prices are now way beyond the Impulsive 2 targets down on our Daily EUR/USD chart. This situation, which is extremely rare, limits our capacity to forecast further downside potential based on this Daily chart. We will address this issue today and offer an alternative solution to come up with a likely scenario for EUR/USD over the next few months.
• we will first review the current EUR/USD situation with the Investor’s View chart below. It will highlight the extended nature of the current move on a Daily basis,
• we will then use FinGraphs’ historical database to highlight similar situations in the past. We have gone back as far as the early 1900s on some assets. The small number of such occurrences will highlight the exceptional nature of them. We will draw some parallels with these situations and current EUR/USD,
• we will then attempt to triangulate a plausible EUR/USD scenario going forward using its JPY and GBP cross rates,
• finally we will consider the incidence of this scenario on the Dollar Index as well as assess the countertrend potential, if in the meantime a rebound should occur
EUR/USD Investor’s View (a combination of a Weekly, Daily and Hourly chart):
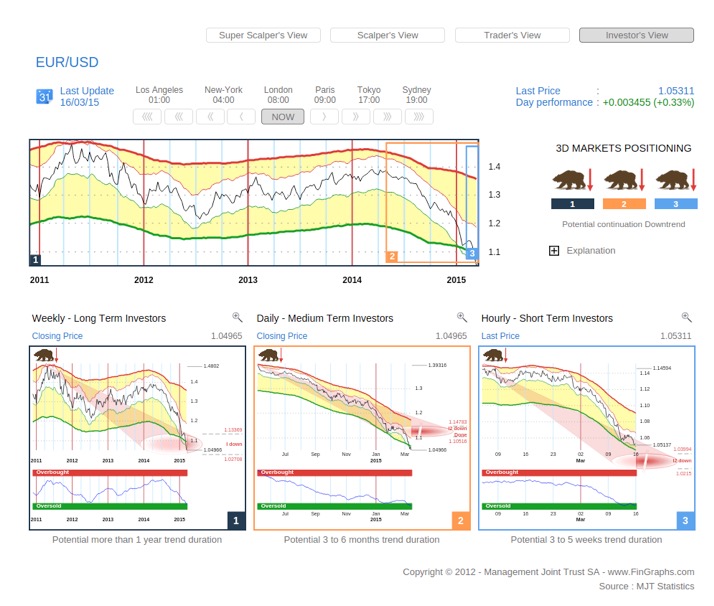
An Investor’s View is a combination of a Weekly, a Daily and an Hourly chart. It is meant to deliver investment perspectives respectively over the next few quarters, months and weeks. As with all FinGraphs charts, each time frame is then analysed using simple indicators: bull/bear for potential trend direction, price projection beams for possible targets and a risk index which oscillates from Overbought to Oversold.
Trends indications and Risk Index:
Trend-wise, all three trends are still heading down (3 Bears). The Risk indexes are all Oversold, yet they are just entering (or re-entering) their Oversold positions. As with other momentum indicators, such situations of exaggeration in the Risk Index can linger on for a while before they eventually start reversing. We could characterise such situations as being in the early stages of exhaustion. No reversal can be confirmed yet. So, from a trend and risk index perspective, it’s basically “Potential continuation Downtrend” for now. We will look to the targets calculation to provide guidance on remaining price potential and eventual timing.
About FinGraphs’ targets:
FinGraphs calculates possible price target zones based on historical volatility. This measure is proxied by “Delta” or the width of FinGraphs’ larger standard deviation envelope (the dark yellow one). “Delta” is calculated as the average divergence from a mean (i.e. a moving average) over the period represented by a FinGraphs’ chart, multiplied by 4 (or 2 standard deviations on each side of the mean). Once “Delta” has been calculated, FinGraphs uses it to project the amplitude of future prices moves. It will typically identify a relevant turning point (bottom or top and then respectively add or subtract factors of “delta” to obtain a possible target zone). FinGraphs differentiates between three target levels: Corrective Targets (0.5 to 0.8 times “delta” from the last turning point), Impulsive Targets (1.3 to 1.7 times “delta”) and for very extended moves, Impulsive 2 Targets (2.3 to 2.7 times “delta”). The time projections attached to the price targets, use standardised assumptions adapted to either Corrective, Impulsive or Impulsive 2 moves. The great advantage of FinGraphs targets is that they can be automatically calculated on any instrument over any frequency of observation. Please revert to our UserGuide on www.fingraphs.com for a more detailed explanation.
Current Weekly targets on EUR/USD:
One feature of FinGraphs targets calculations is that projections are not fixed in time. Indeed, “Delta” is a dynamic concept, it expands or contracts as price moves evolve. This is especially true when price moves accelerate (bubbles and crashes). In such cases, when older divergence data leaves the sample period, it is replaced by new data items with much higher values (prices are rapidly distancing themselves from the mean). The current sell-off in EUR/USD provides a good example. In the Mosaic below, we present several Weekly charts on EUR/USD taken at different time points over the last 6 months.
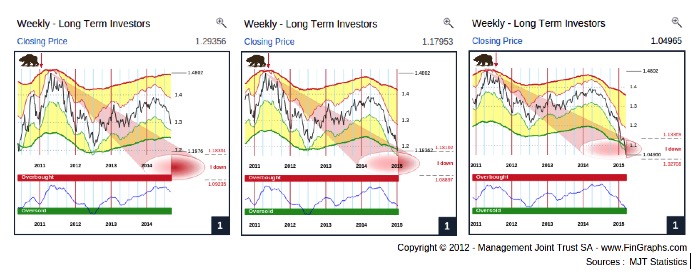
The first one is taken early September as prices are breaking down through 1.30. The impulsive target projection is showing potential down to 1.09235. The second, in mid January 2015, has seen prices accelerate. “Delta” has expanded and the price projection now calculates potential down to 1.07785. Finally, the third shows the picture as of last Friday. Downside potential is now pointing to a lower target boundary at 1.02708.
Below, we provide 2 further examples of such accelerations, on the S&P500 in 2008 and more recently on Brent Oil:
The S&P500 in January 2008, August 2008 and February 2009:
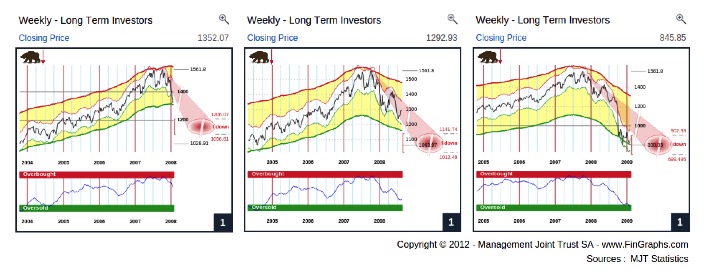
The lower boundary of the FinGraphs’ Impulsive targets have gradually been revised down from slightly below 1’100 to below 700 as the price move accelerates and delta widens.
Brent Oil in January 2008, August 2008 and February 2009:
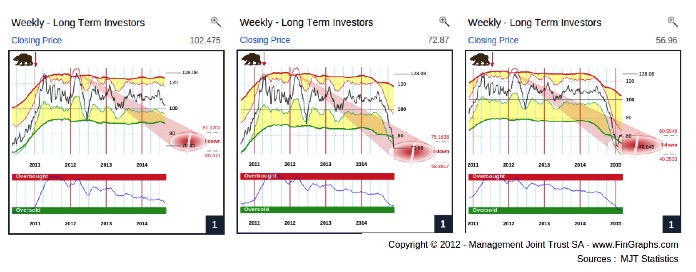
The lower boundary of FinGraphs’ Impulsive targets has been revised down from 66.671 last summer, to 58.8817 towards year end and 40.3533 more recently.
As we can see, in such very strong moves, volatility and the price targets gradually accelerate with the price move. These price objectives may often appear as moving targets before prices eventually catch up with them. Hence, to achieve more precision in forecasting precise target levels, one would consider the Daily chart and attempt to match its targets with the Weekly’s for more robustness.
So for now, EUR/USD is still heading lower on our Weekly charts, prices are still accelerating, “delta” is still widening and price targets are still being revised down. We will consider the Daily targets to see if these could deliver a more precise projection.
Current Daily targets on EUR/USD:
Well, the Daily won’t help us much here. In fact, the linearity and speed of the EUR/USD descent has created an exceptional situation: EUR/USD is well beyond Impulsive 2 targets on its Daily chart (these were left behind slightly above 1.10). Remember, FinGraphs calculates Corrective targets for corrections, Impulsive targets for established trends and Impulsive 2 targets for extended moves. FinGraphs does not calculate Impulsive 3 targets as moves beyond Impulsive 2 targets are extremely rare. We’ve created the table below to illustrate this. It uses FinGraphs Markets Trainer functionality to go back in time on key market drivers to highlight such exaggerations on our Daily charts in the past. We’ve gone back 25 to 35 years on most of these assets. On the S&P500, we went back to the early 1930s and completed the study with the Dow Jones Industrial Index between 1900 and 1930.
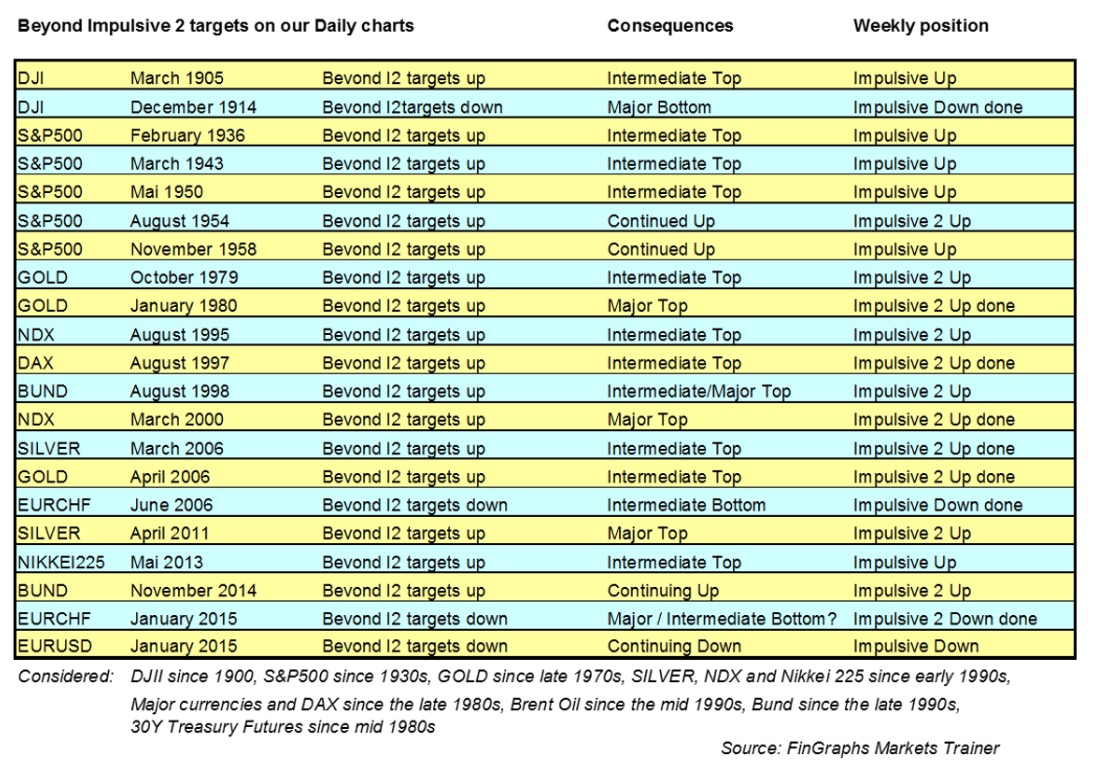
As you can see, these situations are extremely rare (circa 20), especially on currencies (previously only on EURCHF). You will notice that they exclude some of the most recent aggressive moves, which on our Daily charts did not reach such levels of exaggeration (e.g. the market crash in 2008, the 2011 spike in Gold or the recent drop in Oil). One can also notice from this table, that most of these exaggerations do not usually lead to major market turning points. Most of them see the trend continuing on, eventually marking an intermediate top. Only, when the Weekly also reaches extreme levels of targets, do such coordinated exaggerations over the Weekly and Daily charts lead to major reversals (e.g. within Weekly “Impulsive 2 up” for SILVER in 2011, or in Weekly “Impulsive 2 up done” for GOLD in 1980 and NDX in 2000 or to the downside, eventually, “Impulsive 2 down done” for EURCHF today). Once exception would be December 1914 reversal on DJI. Yet, it marks the beginning of WW1 and followed a period of several months when markets were closed (a very particular situation).
To conclude, this table highlights the exceptional nature of the current EUR/USD Daily move versus its calculated historical volatility (“delta”). Yet, similar situations in the past, especially when the Weekly was not yet overextended, have usually led to a continuation of the trend (often following an intermediate top). To draw a parallel, one could position these extended Daily situations in strong accelerations of the Weekly trend (something like an Elliott Wave 3). It is also interesting to note that on GOLD in 1980 and SILVER in 2011, these situations did lead to major tops (this may recall the extended Elliott Wave 5 on Commodities).
Below, we have chosen two similar situations from the past, which in terms of Weekly targets could match the current EURUSD situation (towards “Impulsive up”). We have constrained our analysis to the Weekly and Daily charts as we do not have intraday data going back that far (to create an Hourly chart). Please note that all these historical charts are available for free with no Login on the www.fingraphs.com website. They allow you to train on our methodology. Just go to any directory and access the charts. You will then be able to view all charts older than 3 months. See the Markets Trainer section on our Homepage for more explanations. This database includes years of End of Day charts on 1’000s of instruments as well as more than 10 years of Intraday charts. Please don’t hesitate to send us further historical data in .csv format at support@fingraphs.com to help us further populate this free functionality.
DJI – the run-up of 1905:
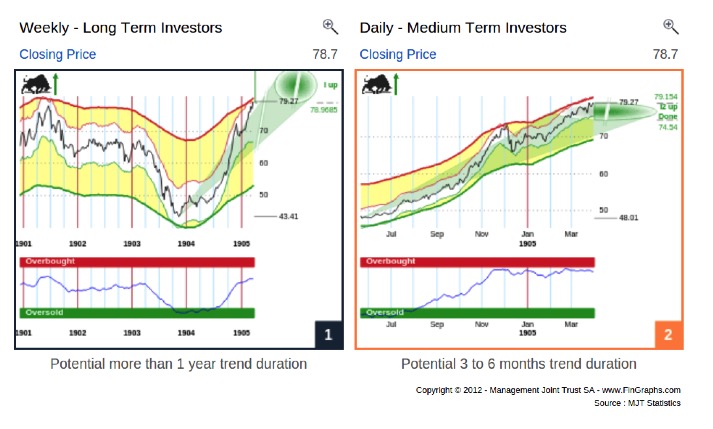
The Daily chart was indeed above Impulsive 2 targets and the Weekly was within a strong Impulsive Uptrend. Price corrected slightly from April to end of Mai and continued up until early 1906.
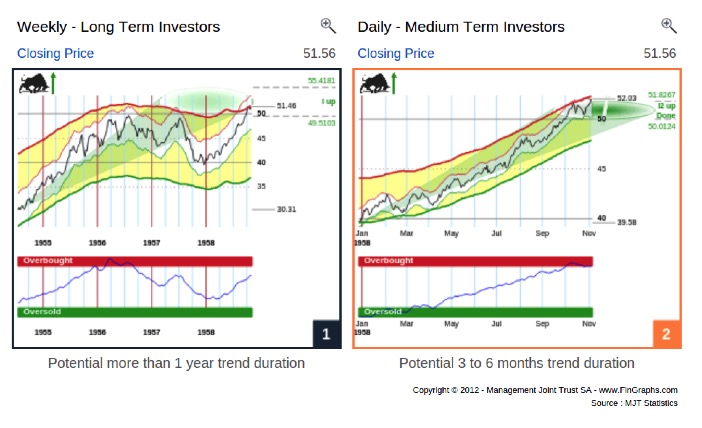
The second situation below may prove to be an even closer match (just in reverse, in a downtrend instead of an uptrend). Following a correction down, which lasted a year and a half, prices on the S&P500 reaccelerated up until they extended beyond Impulsive 2 targets in early December 1958. Yet, the trend continued up until it finally made an intermediate top in early August 1959.
S&P500’s 1958 resume uptrend:
These historical examples may seem far-fetched to some. Yet, the point is, we believe that despite the extended move we have just experienced, the EUR/USD downtrend still has a long way to go. We would hence look to project what we believe should be an intermediate bottom (not a major turning point), possibly over the next few months. We would favour a mid-year timing as it pretty much matches the time target projection on our Weekly chart (please revert to the first chart in this document, left hand time-frame) and may synchronize well with the anticipation of the initial rate hike in the US. Something like buy the rumour, sell the news; or the resultant from a decision to postpone the tightening cycle.
Now, the Weekly is still accelerating (moving target) and the Daily is already way beyond Impulsive 2. So, how are we going to calculate possible price targets?
We will do so by triangulating the EUR/USD prospective exchange rate through its JPY and GBP crosses. Indeed, their trends are less extended as both have recently been stronger than the EUR and weaker than USD. Hence, their price targets projections still offer Daily targets potential from which we can build a scenario.
Triangulating EUR/USD through its YEN crosses:
We will start by using the Investor’s Views on USD/JPY and EUR/JPY and will independent scenarios for both these currency pairs. We will then cross-reference these result in a matrix to derive possible outcomes for EUR/USD.
USD/JPY- Investor’s View:
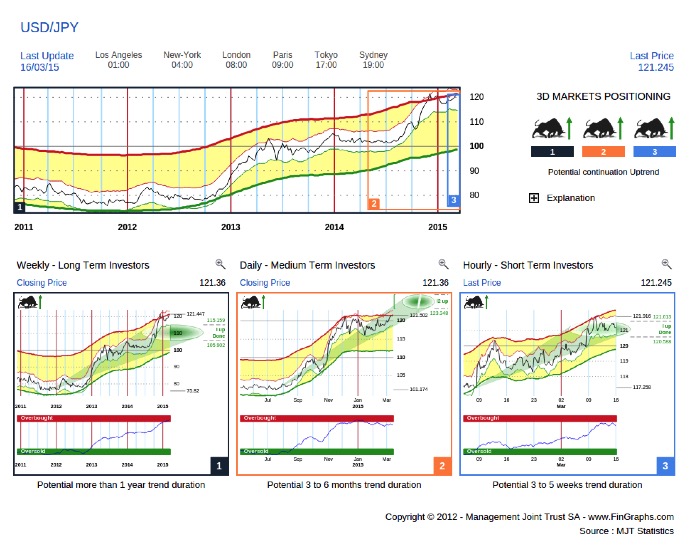
The Weekly (left hand chart) is moving beyond its Impulsive targets up (“I up done”). We believe it will soon trigger Impulsive 2 targets up (2.3 to 2.7 times our delta from the last turning point, i.e. the 2011 low at 75.82). We back calculate “delta” by taking the lower boundary of our Impulsive targets up (105.902) by subtracting the 2011 low (75.82) and dividing it by the factor representing the lower boundary of our Impulsive targets (1.3 times). This calculates to a current “delta” of 23.1 on our Weekly charts. We then reverse the calculation using our Impulsive 2 factors (2.3 times and 2.7 times) to identify the Impulsive 2 target zone we can expect (e.g. 75.82 + 2.3 * 23.1). The resulting Impulsive 2 target zone will be between 129 and 138. On our Daily (middle chart), the Impulsive 2 targets are already active. They extend between 123 and 127. We believe these are achievable as USD/JPY brushes off the recent consolidation and re-accelerates.
Our scenario on USD/JPY is that prices could move towards their Impulsive 2 targets on our Weekly charts (towards the 129 lower boundary of these Impulsive 2 targets). On the Daily, they would fulfil their Impulsive 2 targets up, which if prices accelerate (and delta widens) could lead us up to 127 or even a bit more. Hence, we’ve settled on a Weekly/Daily consensus target of 128 USD/JPY until mid-year. This scenario might sound aggressive, yet it is in-line with our previous contribution in February on Abenomics (http://stockcharts.com/articles/tac/2015/02/fingraphs-japan--abenomics-3-is-only-a-matter-of-time.html). We then argued that Japan could probably not afford to remain passive in light of the current EUR devaluation. Speaking about the EUR, let’s now turn to EUR/JPY.
EUR/JPY – Investor’s view:
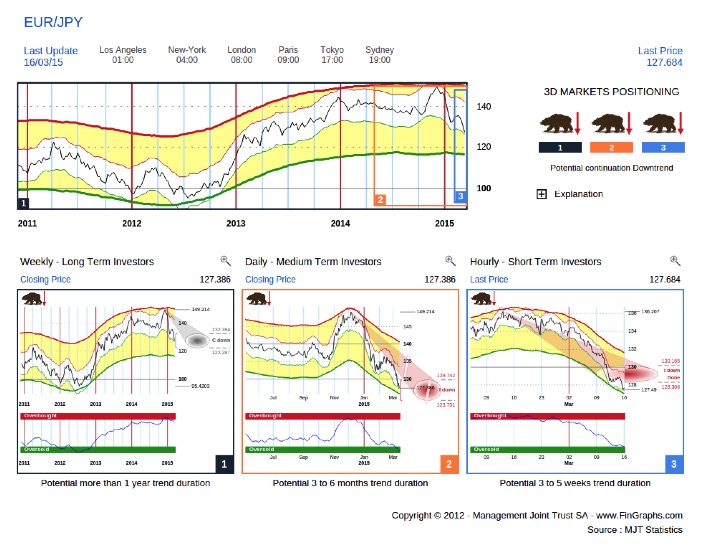
EUR/JPY is in a correction down on our Weekly (left hand charts). This corrective move is not completed yet and could extend a few months more. Weekly targets point to between 132 and 122. On our Daily charts, Impulsive targets down point to levels between 130 and 124 over the next few months. As mentioned above, we believe Japan cannot let EUR/JPY slide too aggressively and at some point will need to react (what we labelled “Abenomics 3”). We have since chosen a consensus target at 125, below current levels, yet slightly shy of the outer boundary of the Weekly and Daily targets mentioned above.
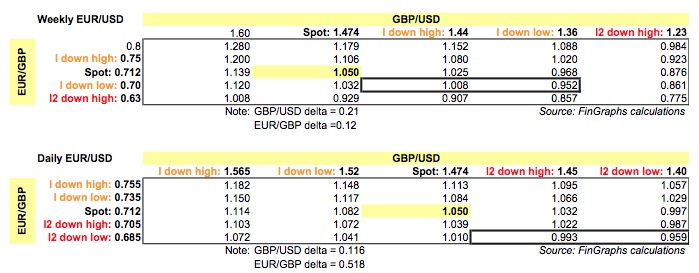
The two matrixes below summarize the result of our analysis for EUR/USD given USD/JPY and EUR/JPY. The boxes within the matrixes highlight the target levels earn-marked for these projections
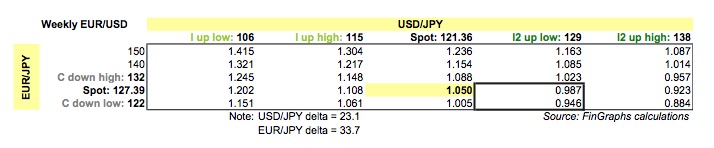
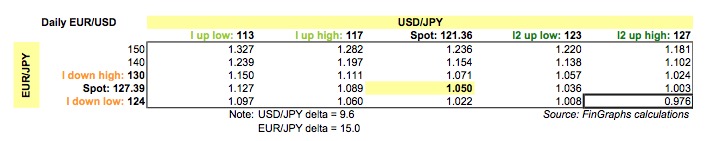
Using our consensus forecasts mentioned above (128 on USD/JPY and 125 on EUR/JPY) would imply a EUR/USD move to 0.975 until mid-year. As a possible confirmation of this scenario, we will now go through the same process using GBP cross rates.
Triangulating EUR/USD through its GBP crosses:
GBP/USD – Investor’s View:
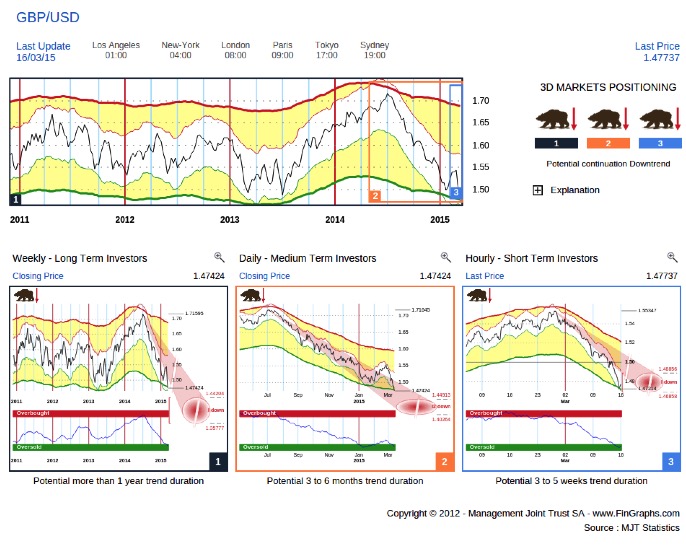
Our Weekly (left hand chart) shows more potential over the next few months (even over the next quarters), possibly into impulsive targets down between 1.44 and 1.36. The Daily (middle chart) just activated its Impulsive 2 targets down. These range from 1.45 to 1.40 over the next few months. We will use 1.41 as a consensus until mid-year. This value is towards the lower end of these Daily targets to reflect further downside potential on our Weekly charts.
EUR/GBP – Investor’s View:
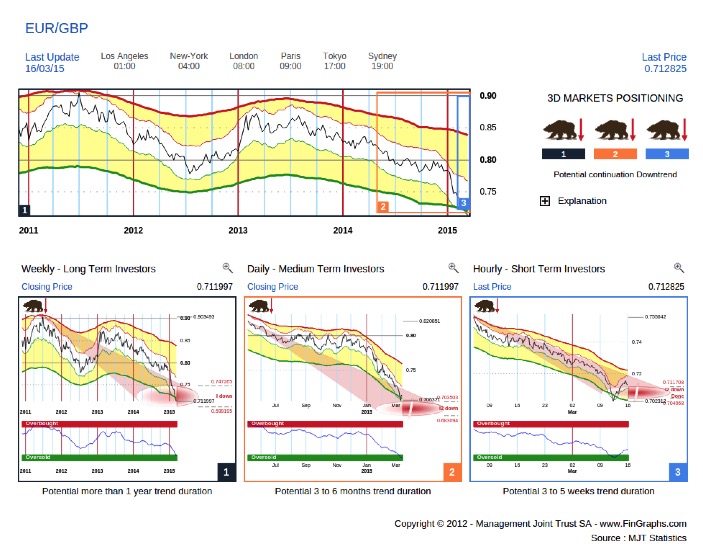
The Weekly chart on EUR/GBP is close to fulfilling its Impulsive targets down with potential down slightly below 0.70. The Daily (middle chart) is nearing Impulsive 2 targets between 0.70 and 0.68. We will use 0.69 as a consensus target on EUR/GBP until mid year.
Again, the two matrixes below summarize these relationships on both a Weekly and Daily basis for EUR/USD given GBP/USD and EUR/GBP.
Converting these values into the DXY Dollar Index:
From our calculations above, we have derived 0.975 on EUR/USD, 138 on USD/JPY and 1.41 on GBP/USD as possible mid-year targets. These three currencies together accounts for 83% on the weighting in the Dollar Index (57.6% for EUR/USD, 13.6% for USD/JPY and 11.9% for GBP/USD). If we extrapolate that our targets on these three currencies can proxy the development on the remaining 17% of the DXY currency pool, one could project an 8% weighted progression of the index until mid-year. With the Dollar Index slightly above 100 as we write, our analysis would suggest a 108 mid-year target. Let’s now turn to the Investor’s View of DXY to see if we can confirm this scenario.
DXY Dollar Index – Investor’s View:
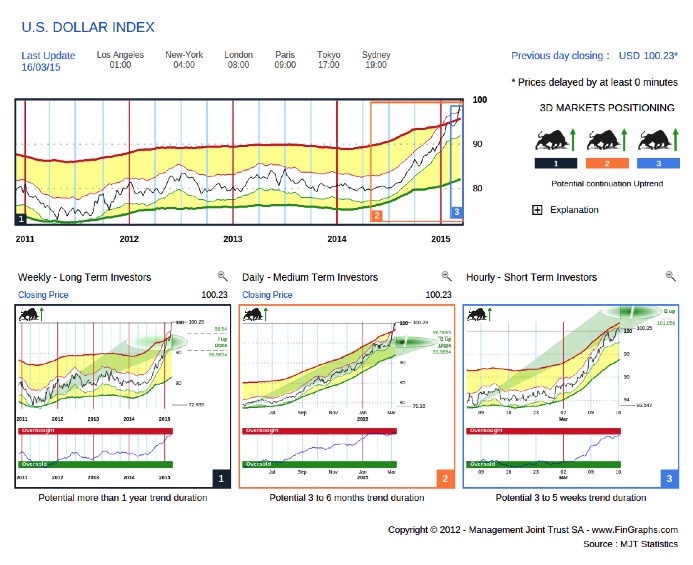
As with EUR/USD, the Daily targets (middle chart) are beyond Impulsive 2 targets (“I2 Up done”). The Weekly (left hand chart) has fulfilled Impulsive targets up (“I up done”), yet its Risk Index is just entering the Overbought zone. If we were to back calculate “delta” (13.9) and derive Impulsive 2 Weekly targets, these would result in an Impulsive 2 target zone between 105 and 110. This could match our 108 targets calculated above based on EUR/USD, USD/JPY and GBP/USD.
We understand, all these targets sound aggressive. Yet, aren’t we in the middle of a currency war? Obviously, we will monitor these developments closely over the next few months. One important test will be to focus on the extent on an Hourly countertrend when/if it does materialise. Ideally, we would expect that an Hourly countertrend remains within the boundaries of corrective Hourly targets. Let’s consider the Hourly Mosaic below on the set of currency pairs we have been through:
Hourly Mosaic on USD/JPY, EUR/JPY, GBP/USD, EUR/GBP, EUR/USD and DXY:
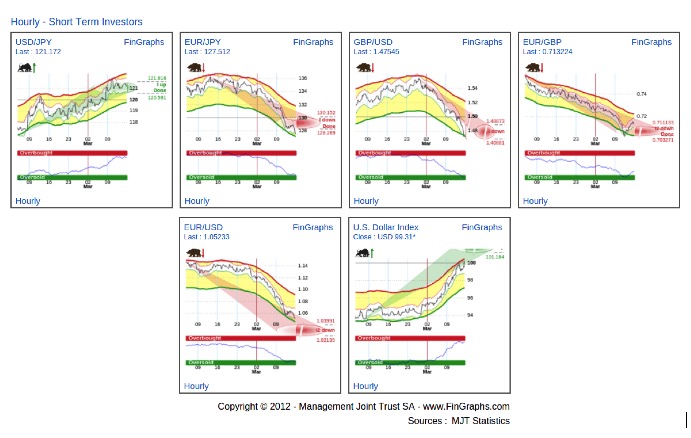
These current Hourly trends are still in place, yet they are all pretty close to their possible price target zones. Let’s assume these trends settle at current levels (USD/JPY at 121.36, EUR/JPY 127.39, GBP/USD at 1.474, EUR/GBP 0,712, EUR/USD 1.05 and DXY 100) and create a base for an Hourly countertrend move (not confirmed yet). We could then back calculate our Hourly “deltas” and apply our 0.8 times “delta” full corrective factor to them. I will spare you the calculation details, but this would result in Hourly countertrend potential of circa 4 to 5 figures on EUR/USD and a bit more that 3 on DXY (respectively 2 figures on USD/JPY, 3.5 on EUR/JPY, 3.5 on GBP/USD and 1.5 on EUR/GBP).
We believe such a countertrend move could materialise at some point between now and early April. Following that, current Weekly and Daily trends should resume towards a mid-year intermediate bottom on EUR/USD (top on DXY). Such intermediate inflection points are usually followed by 3 to 6 months of consolidation before trends resume their previous direction: down again for EUR/USD and up for DXY from end 2015/beginning 2016.
For more information on our methodology click here (http://www.fingraphs.com/#couponid-STKCHARTS14) and then view the Introduction slide-show and visit the ‘User Guide’ section on our website. Clicking that link also qualifies you for a 7 day demo and a 10% discount on our services if you choose to subscribe.
Have a great start to your week, J-F Owczarczak (@fingraphs)