
Monitoring purposes SPX; Long SPX on 3/18/15 at 2099.42.
Monitoring purposes GOLD: Gold ETF GLD long at 173.59 on 9/21/11
Long Term Trend monitor purposes: Flat
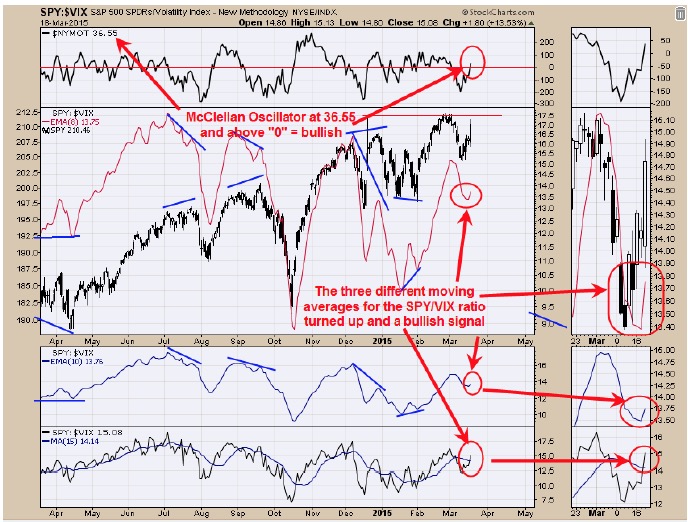
We showed this chart yesterday (SPY/VIX ratio with three different moving averages) and at that time it was not bullish. After the FOMC summary today all three moving averages of the SPY/VIX ratio turned up and a bullish signal for the market. The Top window is the McClellan Oscillator and readings above “0” are considered bullish and today’s reading closed at +36.55. We have other indicators that turned bullish today (not shown) and suggests a rally has started. Long SPX on 3/18/15 at 2099.42.
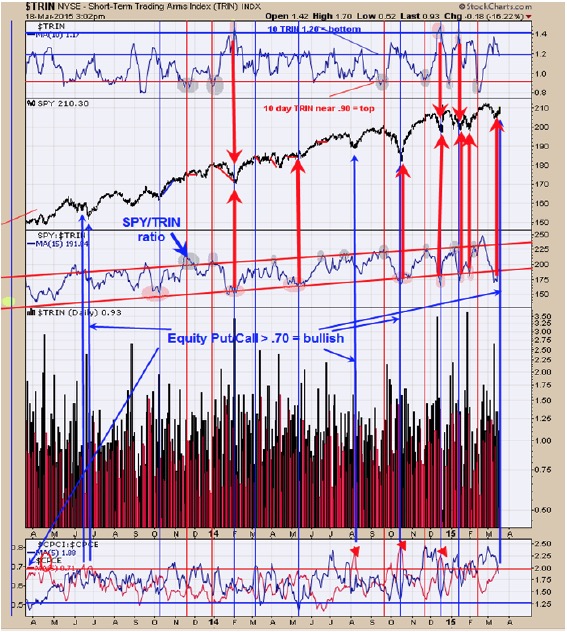
The SPY/TRIN ratio (middle window) has been bullish for the last week. Sometimes going into the FOMC meeting (Yesterday and today) can be tricky as there may be a whipsaw. Once the Summary of the FOMC meeting was released today the market took off. The bottom window with the red line is the Equity put/call ratio. Readings above .70 are bullish signs for the market and yesterday’s reading came in at .71. The top window is the 10 day moving average of the TRIN. Readings above 1.20 have been a bullish sign for the market and this indicator has been above 1.20 over a week. Most of indicators turned positive today and suggests the rally should continue. Long SPX on 3/18/15 at 2099.42.
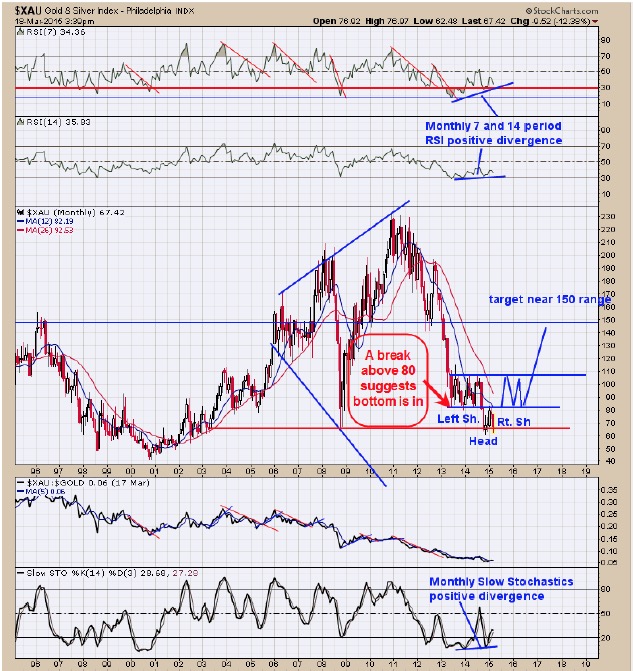
Above is a monthly XAU chart dating back to 1994. The top two windows are the monthly 7 period RSI and below that the 14 period RSI and both are showing longer term bullish divergence. The bottom window is the monthly Slow Stochastics and it too is showing a longer term bullish divergence. The pattern that may be forming on the XAU is a monthly Head and Shoulders bottom and in our view the Head is forming now and may take several more monthly to complete. A break above 80 on the XAU would suggests the bottom is in. If the XAU does manage to break above 80 later this year, this condition would suggests a continued rally to 110 range which are the high of late 2013 and early 2014 and a resistance area. If this pattern is indeed a Head and Shoulders bottom than there is symmetry in these pattern both in time and price. If the Left Shoulder took about a year to form than the Right Shoulder should be near the same timeframe which would make the completion date some where near Mid 2016. Lets not get ahead of ourselves and lets get the 80 range on the XAU broke through later this year and see what develops. With the positive divergences on the monthly timeframe, it would appear most of the wait is done.
Tim Ord
Editor
www.ord-oracle.com