
Monitoring purposes SPX; Sold SPX on 3/3/15 at 2107.78= gain 2.82%; Long SPX 2/3/15 at 2050.03.
Monitoring purposes GOLD: Gold ETF GLD long at 173.59 on 9/21/11
Long Term Trend monitor purposes: Flat
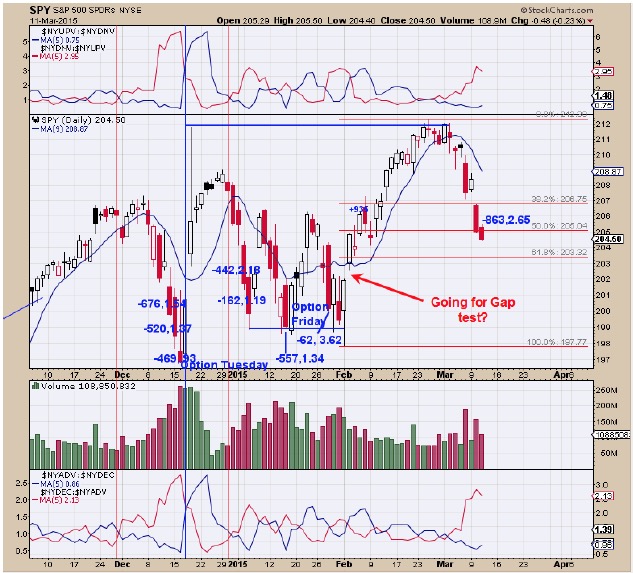
The blue numbers represent the tick closes and Trin closes. Yesterday’s trin closed at 2.65 and Ticks at -863 and a bullish combination suggesting a low is near. Most worthwhile lows form from Thursday the week before option expiration to Tuesday of Option expiration and we are entering that window now. A possible target for the next low is the gap that formed on February 3 which comes in near 202 range. Page two describes way to identify bottoms in the market and we use the TRIN, TICK and VIX. So far the VIX is not showing much fear and the next day or two may change that. Bottom appears still incomplete. Sold long SPX on 3/3/15 at 2107.78 for gain of 2.82%; Long SPX at 2050.03 on February 3, 2015.
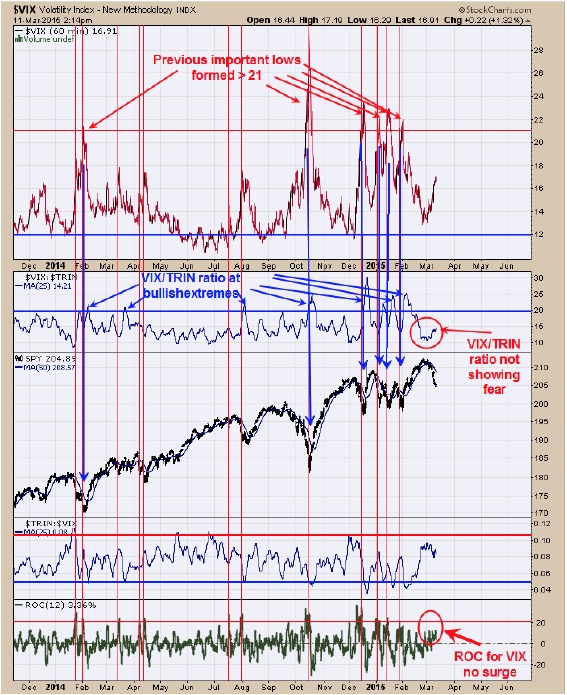
Above are the different VIX indicators that helps us find turning points in the market. The bottom window is the Rate of change (ROC) of the VIX. At previous important lows in the market the ROC for the VIX jumped > 20% (shown by red verticals lines). The reading today came in at 3.36% suggesting there is little fear in the market and not what usually present at bottoms. The second window down from the top is the VIX/TRIN ratio. This ratio normally jumps > 21 near bottoms in the market. As you can see this ratio is closer to where tops form than bottoms, which suggests market bottom is incomplete. The top window is the VIX. Over the last 12 months, market bottoms have formed when the VIX reached > 21. Bottoms in the market form with panic and the VIX, TRIN and Ticks help to gauge panic. The TRIN and Ticks have reached panic levels but so for the VIX has not. Each bottom in the market form a little differently and maybe this time around the VIX will not reach bullish levels. Once a bottom has formed, there is usually a “Sign of Strength” off the low to signal a bottom is in and a condition that will puts us in the market. For now we are thinking there may be another couple of days before the bottom is completed. Sold long SPX on 3/3/15 at 2107.78 for gain of 2.82%; Long SPX at 2050.03 on February 3, 2015.
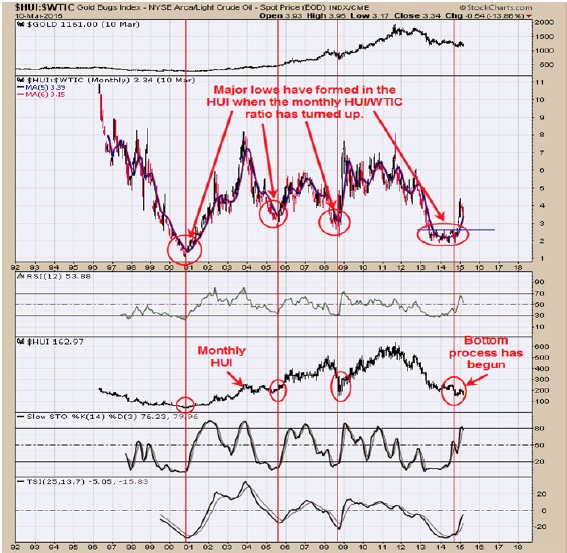
On Monday’s report we showed the bullish monthly divergence for the RSI, Slow stochastics, MACD and True Strength index for the HUI. We also said momentum needs to turn up to say a bottom is in of which at this time it has not. The chart above helps to show another bullish setup that has already been triggered for the HUI. The Ratio above is the monthly HUI/WTIC (Gold Bug index and Light Crude oil). This ratio turned up at all the major turns going back to the 2000 bottom. It turned up again in January of this year suggesting a major low is forming. Some bottoms take longer to form than other bottoms and the current bottom pattern on the HUI/WTIC ratio started back in 2013. Again momentum needs to turn up on HUI to show a bottom has formed and so far that has not happen. There are cycle lows due in July and August and maybe the time where momentum turns up.
Tim Ord,
Editor
For Free 30 day trial to The Ord Oracle, just drop us your email to tim@ord-oracle.com.