
Monitoring purposes SPX: Flat.
Monitoring purposes GOLD: Short GDX on 4/7/15 at 19.22; stop 21.26.
Long Term Trend monitor purposes: Flat
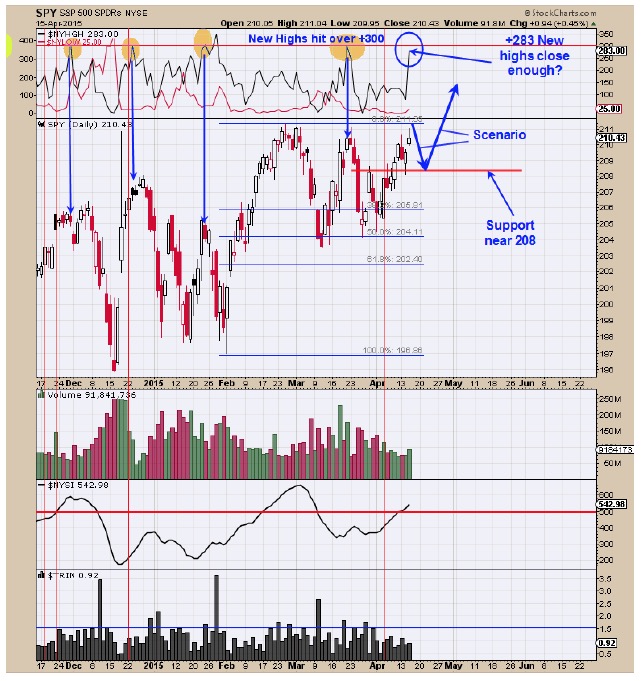
The market is extended by our measures (see page two) but does not mean a pull back will happen here but it could. The bigger trend remains bullish. Today the SPY did trade above Monday’s high but was unable to hold that high and closed up today but below Monday’s high which is called an “Upthrust”. An “Upthrust” predict if a market can hold above its previous high it will reverse an attempt to take out the previous low (which is yesterday’s low). Today the New highs on the NYSE hit +283 and previous times it has hit +300 the market stalled short term. The question is if +283 new highs are close enough to +300 to stall the market short term. There is a possibility that yesterday’s low could be tested and if it does than a bullish sign could be triggered.
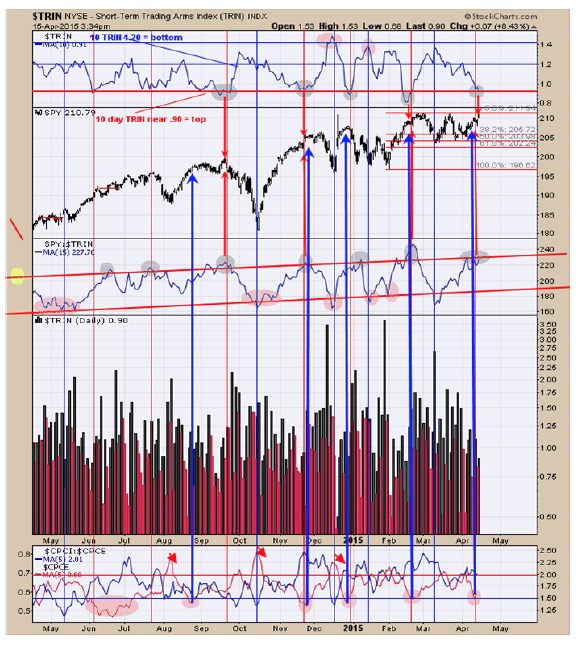
We showed this chart on Monday. The top window is the 10 Day average of the TRIN. When this average gets down below .95 (current reading is .91) the market is extended. The window below the SPY chart is the SPY/TRIN with a 15 period moving average. When this ratio is at the upper red boundary line, the market is considered extended (noted with gray circle). The best signal come when the 10 day TRIN and the SPY/TRIN ratio are both in extended territory (marked with red arrows), which is the condition we are in now. The bottom window is the Equity put/Call ratio with 5 period moving average (red line). When the equity put/call ratio reaches below .60 the market is extended and current reading is .60. With the above statistics it appears the market is extended and due for a short term rest. The sideways pattern that began at the February high has only retraced about 50% of the move that began from the early February low and suggests this pattern sets at the half way point of the move. This would give an upside target on the SPY near 217 on the SPY. The bigger trend is bullish but the short term trend is extended. There is a cycle low due April 20-21 (next Monday – Tuesday plus or minus a day).
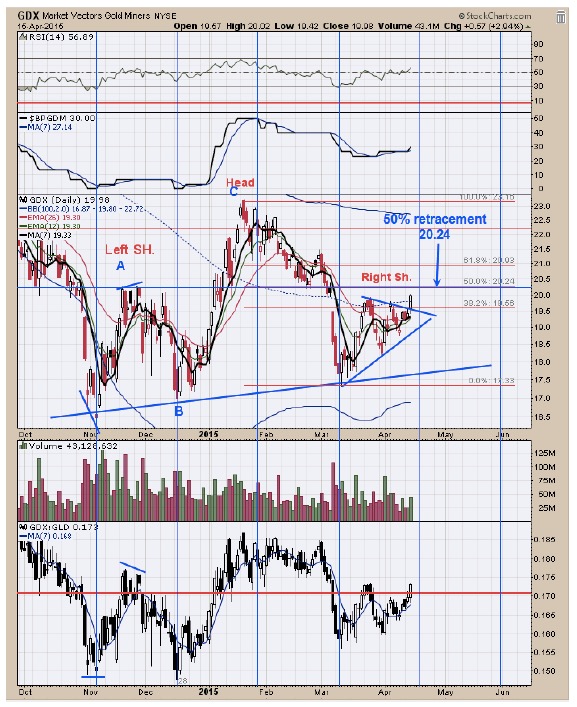
The pattern that appears to be forming since last November is a Head and Shoulders top where the Head is the January high. A “Triangle pattern” has been forming since the March low. It common for “Triangles” that the first breakout is the false breakout and the real move is in the opposite direction. Its to soon to say that will be the case here. Since GDX did break below strong support near 20 back in early March with a “Sign of Weakness” (confirming the break), the most likely scenario is a Head and Shoulders top is forming and the “Right Shoulder” is forming now and once completed would lead to a break of the Neckline near 18 and have a downside target near 13. Short GDX at 19.22 on 4/7/15; stop at 20.26.
Tim Ord,
Editor
For examples in how "Ord-Volume" works, visit www.ord-oracle.com.