
Monitoring purposes SPX: Short SPX on close (4/29/15) at 2106.85.
Monitoring purposes GOLD: Flat
Long Term Trend monitor purposes: Flat
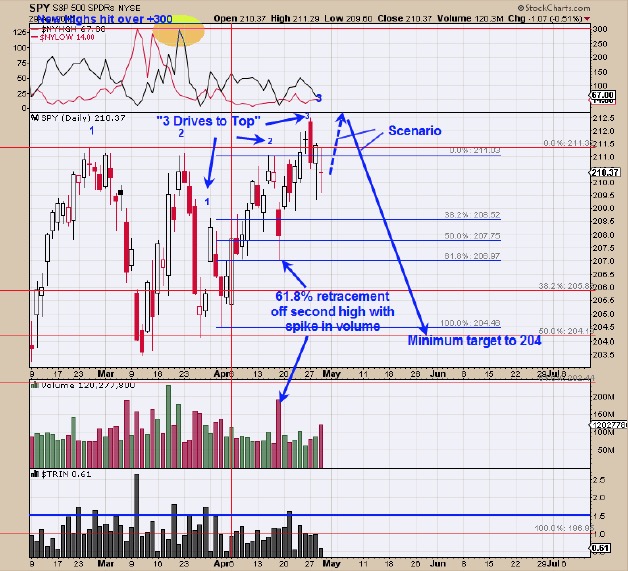
The pattern that could be forming since the March 26 low is a “Three Drive to Top” pattern. The key for the development of this pattern is that the decline off of the second top should be 61.8% or greater retracement of the previous leg up with an increase in volume. Both requirements where met on the current pattern. After the 61.8% retracement the market rallies to new highs creating a third high. Sometimes the “Third high” is tested making a double top before the market heads lower and that could develop on the current pattern and is why we did the checkered arrow for the possible test. Once the third high is completed the market retraces back down to where the pattern began at a minimum. In the current situation, it would imply a retracement down to 204 range. Short SPX at 2106.85 on 4/29/15.
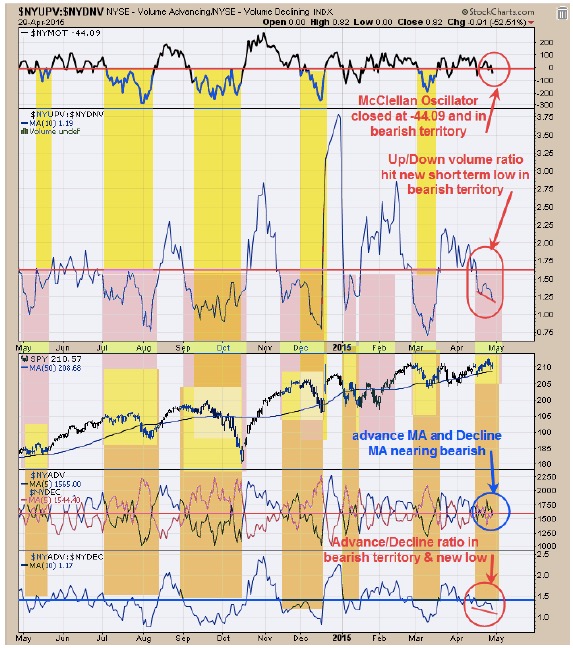
The above chart shows the internals of the market which currently are weakening. The top window is the McClellan Oscillator which closed today at -44.09: readings below “0” are considered bearish. Next window down is the NYSE up volume/NYSE down volume with 10 period moving average. Readings below 1.65 are bearish and today’s reading came in at 1.19 and a short term new low, showing weakness. Bottom window is the NYSE advance/NYSE decline with 10 period moving average. Readings below 1.45 are bearish and today’s reading came in at 1.17 and a short term new low also showing a weakening position. Next window up is the NYSE advance with 5 period moving average and NYSE decline with 5 period moving average and this chart is barely on a bullish crossover and narrowing and showing a weakening stances. Of the four indicators on this page; three have bearish readings and in weakening positions and the fourth is barely on a bullish crossover and narrowing.
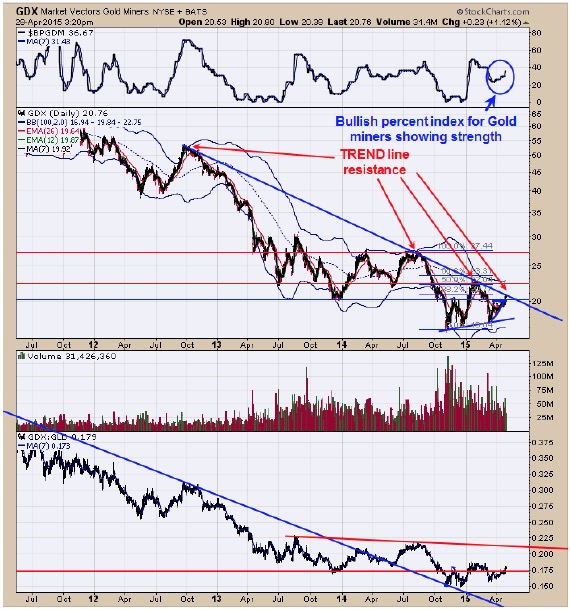
The “line in the Sand” is the horizontal at 20.21 which is the December 2013 low and the November 2014 high which GDX broke through yesterday with a “Sign of Strength” and now that area is support. The chart above goes back a couple of years and shows GDX running into a resistance line down from the late 2012 September high. Ideally one would like to see GDX rally through this trend line with another “Sign of Strength” which would bode well for the larger trend. The top window is the bullish percent index for the Gold miners and since early April the bullish percent index has been moving higher, showing more stocks in this index are going on point and figure buy signals and a bullish sign. Lets see what happens at this trend line and see if GDX can push through with a “Sign of Strength” or that it backs away. The bottom window is the GDX/GLD ratio. Ideally one would like to see this ratio trend higher as that shows gold stocks are outperforming gold and a bullish sign for both gold and gold stocks. Right now GDX/GLD ratio is trend higher and suggests GDX may break through the trend line mentioned above. What ever the case GDX decides to do, it will give clues to what to do next.
Tim Ord,
Editor
For examples in how "Ord-Volume" works, visit www.ord-oracle.com.