
How to Identify Support Levels
The Rounding Top Candlestick Pattern used to be a rare topping pattern, however in the last few years this type of top is the most commonly missed topping formation. It goes unnoticed until there is a sudden downside run, often on High Frequency Trader HFT volume surge with a gap down or huge point run down.
The reason most technical traders miss the Rounding Top Candlestick Pattern, is because it starts out as an apparent sideways pattern which slowly bends over into a rounding shape that is harder to recognize early on. At times this candlestick pattern will appear to be valid runs luring the unaware Swing trader into the range, only to whipsaw the trade. Many times the highs of the Trading Range as it rounds will have one higher high that is perceived by technical traders as a breakout pattern, but it fails to sustain and the stock then quickly succumbs to downside pressure.
At this time many stocks in the Dow 30 and S&P500 have started a Rounding Top Candlestick Pattern developing a bending trend, or the top is completed and the stock is trending down.
Support levels for determining where a stock will bounce up during selling short after the rounding top is often a challenge for technical traders as the sideways pattern is not clearly defined due to the bending shape of the rounding top.
It is imperative to identify all bounce levels for selling short as these areas are where the uninformed “buy on the dip” investors enter, and many professionals anticipate the buy on the dippers and actually initiate the bounce with buy to covers.
The chart example below of The Travelers Cos., Inc (NYSE: TRV) developed a Rounding Top Candlestick Pattern as Dark Pools quiet rotation started, after a vertical Angle of Ascent™ that was unsustainable.
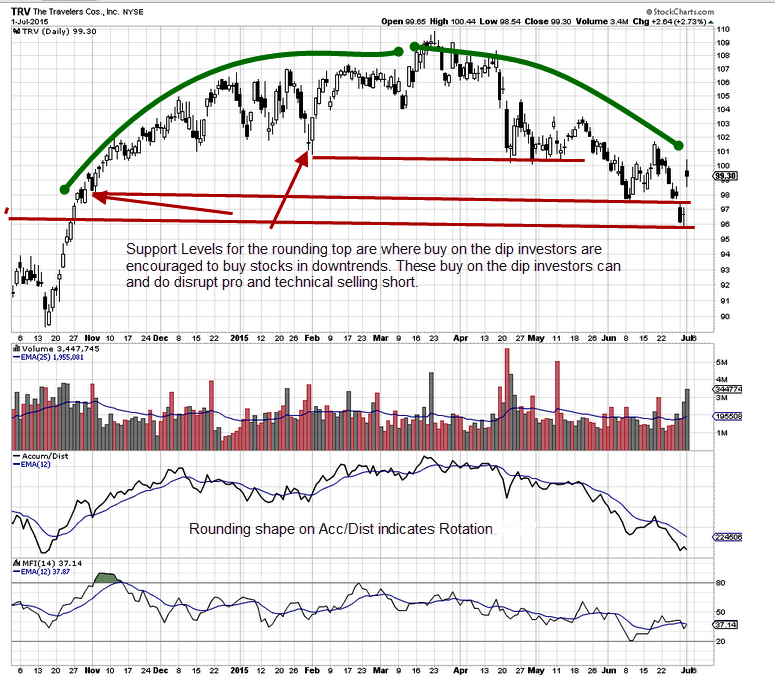
The stock briefly shifted sideways then each time smaller lot buyers moved in, the rotation selling by the Dark Pools began the bending of the trend. Rather than clearly higher peaks and valleys, the stock was unable to make definitive higher highs and higher lows.
“Buy on the dip” investors often are buying at lows of prior retracements and/or at minor support levels. This is the snag for most technical traders who assume the weaker support is not a bounce risk factor.
The bounce areas on a rounding top are often weak support levels as the “buy on the dip” strategies are based on fundamental support rather than technical support for the stock.
Rounding shapes also will appear on large lot versus smaller lot indicators, which at times are easier to see.
Rounding Top Candlestick Pattern tops are far more common nowadays than in prior decades. The recent changes to the order types, Alternative Trading System ATS venues, algorithms for Dark Pool buying, and selling off the exchanges are the primary causes of this change to common topping patterns.
Use the Weekly view on charts to see Rounding Top Candlestick Pattern formations more easily.
Trade Wisely,
Martha Stokes CMT
www.TechniTrader.com
info@technitrader.com