Monitoring purposes SPX: Long SPX on 6/25/15 at 2102.31.
Monitoring purposes GOLD: Flat
Long Term Trend monitor purposes: Flat

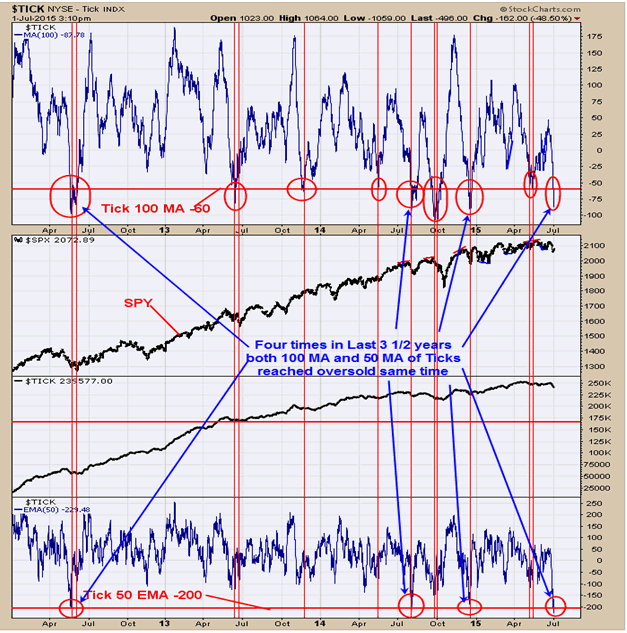
We do a lot of work with the TRIN and Ticks. The above chart is the Tick (top window) with 100 period moving average below that is the SPY and the bottom window is the 50 period moving average. Going back three and half years there where four instances when the 100 period Ticks was in oversold levels with the 50 period Ticks at the same time. We have pointed out theses instances with blue arrows. In each case the market was near or at a low and we are expecting the same outcome here.

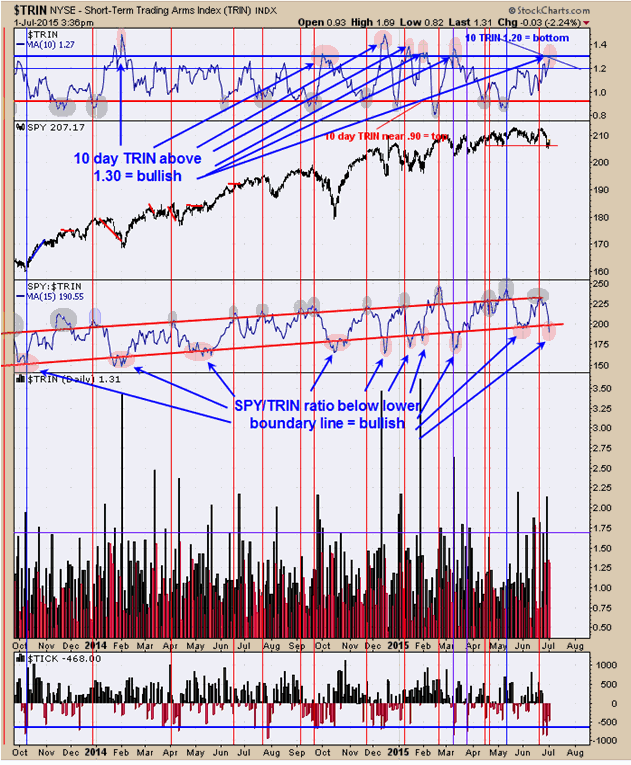
The top window is the 10 day average of the TRIN. Readings above 1.30 normally appear near short term bottoms in the SPY (denoted with tan circle). The middle window is the SPY/TRIN ratio with a 10 period moving average. Worthwhile lows form in the SPY when this ratio is below the lower boundary line (denoted with tan circle). The most reliable signals come when both the 10 day TRIN is above 1.30 and the SPY/TRIN ratio is below the lower boundary line: both denoted with tan circles and which is the present condition. We are long the SPX on 6/25/15 close at 2102.31.

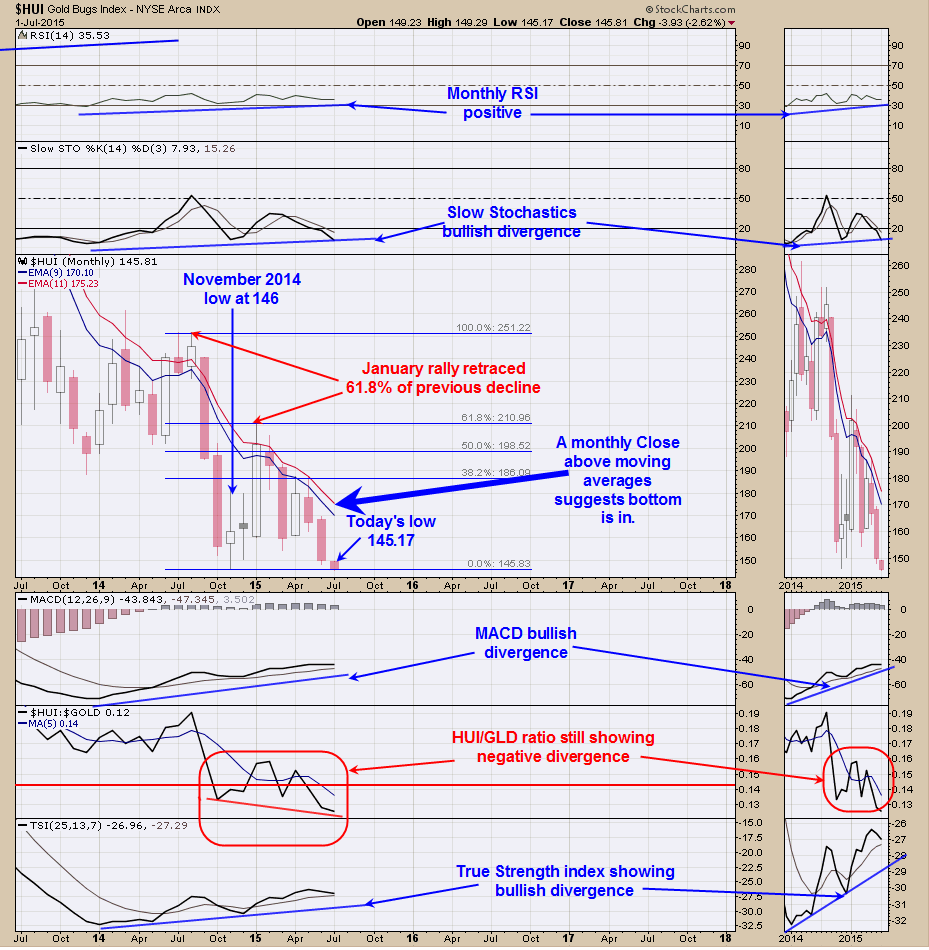
On Yesterday’s report we said, “Panic may appear when the HUI/GLD and XAU/GLD ratio break to new lows below the December 2014 lows and panic is where bottoms form. There are cycles for a low due in July or August (could show up in September as cycles are big) and we are nearing this important time frame.” Well the screaming should start to commence as today the HUI broke and closed below the November 2014 low of 146 with a low of 145.17 and a close of 145.81. So far the monthly RSI; Slow Stochastic; MACD and True Strength index are holding the positive divergences. The HUI/Gold ratio broke to a minor new low today and remains bearish for now. The January rally retraced 61.8% of the previous decline and suggests the next time down (which is now) should produce a double bottom near the November 2014 low. Signal is incomplete but this is the area where a bullish signal could complete. A close above the 9 and 11 moving average on the HUI index on the monthly time frame will suggests the bottom is in and that price comes in near the 175 range.
Tim Ord,
Editor
