
Technical Traders Have Decided Advantage for Selling Short
Topping patterns have undergone dramatic changes in the past decade due to Market Structure changes which have created new types of venues, orders, routing, and Market Participants. Once the new topping formations are identified, the next analysis must be where small, minor non-reversal runs aka bounces will occur. This is one type of the analysis that all Sell Short Traders need to do prior to selling short.

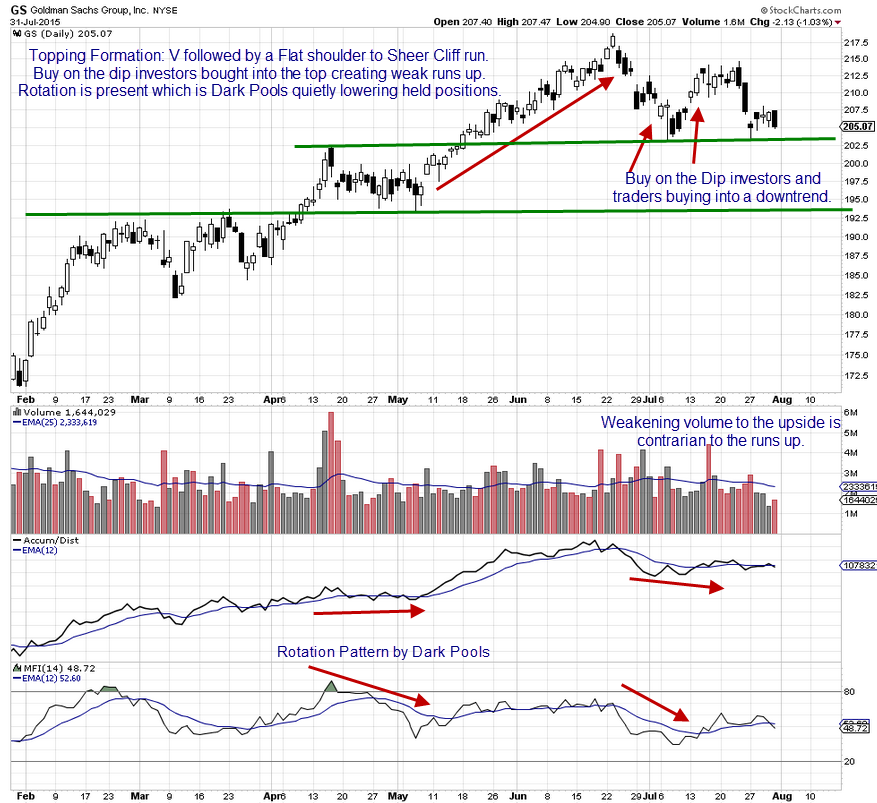
It is also a critical analysis for Position Traders and Long Term Investors to determine the best exit strategy, IF they decide to sell the stock. Ultimately selling into a bounce has lower risk, for a late exit out of a stock by a Position Trader or Long Term Investor. In chart example below of Goldman Sachs Group, Inc. (NYSE: GS) ideally these two longer hold groups would already be out by now, using tighter trailing profit stops as the stock revealed topping action.
The top is clearly defined, where it will encounter Buy the Dip investors and traders is relevant to how and when these two groups buy which is usually percentage based.
The first bounce area is typically caused by Small Lot Investors or Retail Traders using the “Buy the Dip” strategy, unaware that they are buying into a technical downtrend. The downside of the market is predominantly Technical Traders using sell short techniques, stop losses being hit, and Quiet Rotation™ by the giant funds hidden Dark Pools.
Buy the Dip investors and traders tend to show up at the early stages of the first run down of a top. Their candles are inconsistent and the runs are weak, often succumbing to Quiet Rotation by giant funds or sell short large lots quickly. The Buy the Dip order is often an “At Market” order OR a simple Limit Order, both of which allow the Market Makers to gap the stock prior to open depending upon the ratio of sellers to buyers at that time. Gaps are common when Buy the Dip strategy is being used by the investors and traders using smaller lots or odd lots.
From there, technical support levels will create bounces as Professional Traders and High Frequency Traders HFTs move in to drive price down in strong sell short runs. Support levels that are at the highs of a month are weaker, especially if it is a Consolidation or Platform.
The lows of a true Platform are stronger support levels especially if these are connected to the highs of a previous sideways action as seen in the chart example of GS. The tight Platform lows of late April to May, are strengthened by the previous highs of February to March.
However once that support is broken through, the stock has plenty of points it can fall to the next lower levels. Since March was a very volatile price action month with a lack of consistent lows, this area is much weaker support for a stock driven down by HFTs and Professional Traders. If these two groups start selling the stock down, March support is a high risk area for faster downside action.
GS is a big name company and the HFTs frequently are in this stock, especially for big news such as Earnings Reports.
Summary
Understanding which Market Participant Group is likely to be buying at which support level, provides invaluable information on what to expect for the near term price action. This thereby allows Technical Traders the decided advantage of being able to anticipate how price will behave, how long and how far the bounce will last and move up, and when it will weaken sufficiently to provide the ideal sell short entry ahead of the Professional Traders and HFTs.
Technical Traders who are planning on selling short a stock need to study the Support and Resistance levels before entering the trade. In that way exit strategies can be determined in advance of the stock moving into those levels.
Trade Wisely,
Martha Stokes CMT
www.TechniTrader.com
info@technitrader.com