
Monitoring purposes SPX: long SPX on 11/2/15 at 2104.05
Monitoring purposes GOLD: Long GDX on 11/20/15 at 13.38.
Long Term Trend monitor purposes: Flat
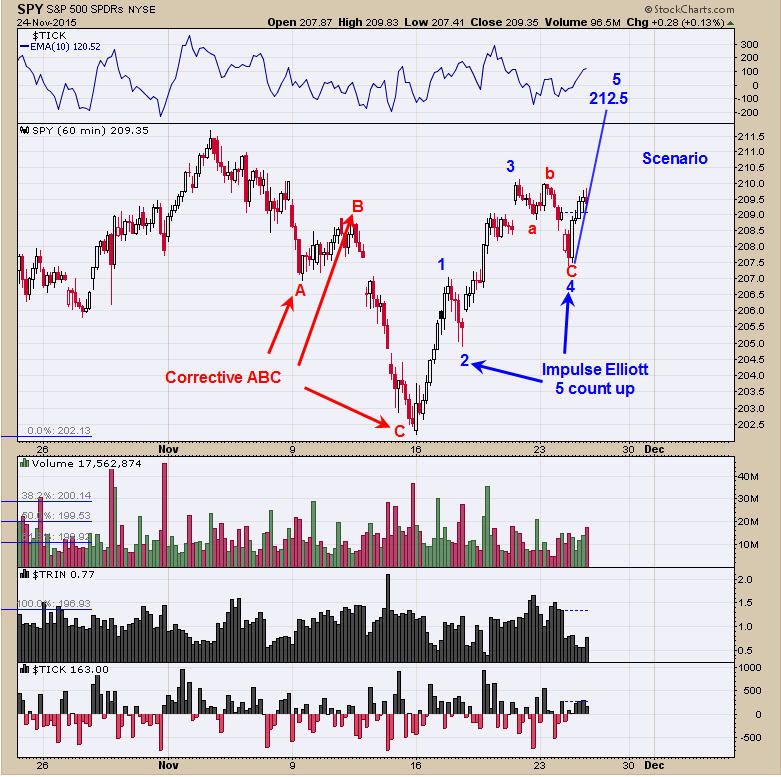
The chart above is the 60 minute chart of SPY. In Elliott wave terms, from the November 3 high, SPY retraced in an ABC corrective pattern into the low of November 16. If a market traces in an ABC corrective, then next wave up should go into an impulse wave of a five count and it appears that is what happening. It appears corrective Wave 4 ended today and Wave 5 up has started. Wave 1 and Wave 3 are near equal and suggest Wave 5 could be extended. If however Wave 5 is just Equal to Wave 1 and 3 (which is near 4.5 points), would give a target to 212.5 range on the SPY at the minimum, but if Wave 5 is extended could go higher. The rally appears to have further to go and we remain bullish for now. Follow us on twitter https://twitter.com/ordoracle
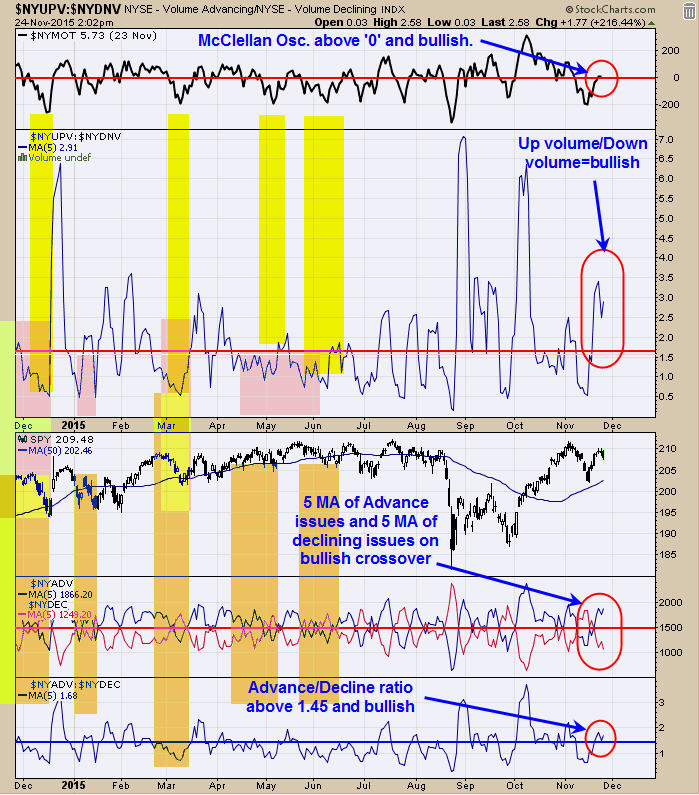
The chart helps to define the momentum of the market. The top window the McClellan Oscillator and readings above “0” are a bullish sign and today’s reading finished at +38. Next window down is the NYSE up volume/NYSE down volume with a 5 period moving average. Readings above 1.65 are bullish for the market and today’s reading came in at 2.91. Bottom window is the NYSE advancing issues/NYSE declining issues with a 5 period moving average. Reading above 1.45 is bullish and today’s reading came in at 1.68. Next window up is the NYSE advancing issues with 5 period moving average and NYSE declining issues with 5 period moving average and this indicator remains on a bullish crossover. We have said on previous reports, “When October > 5% ( up near 8%) and up year to day (check) than November never been lower.
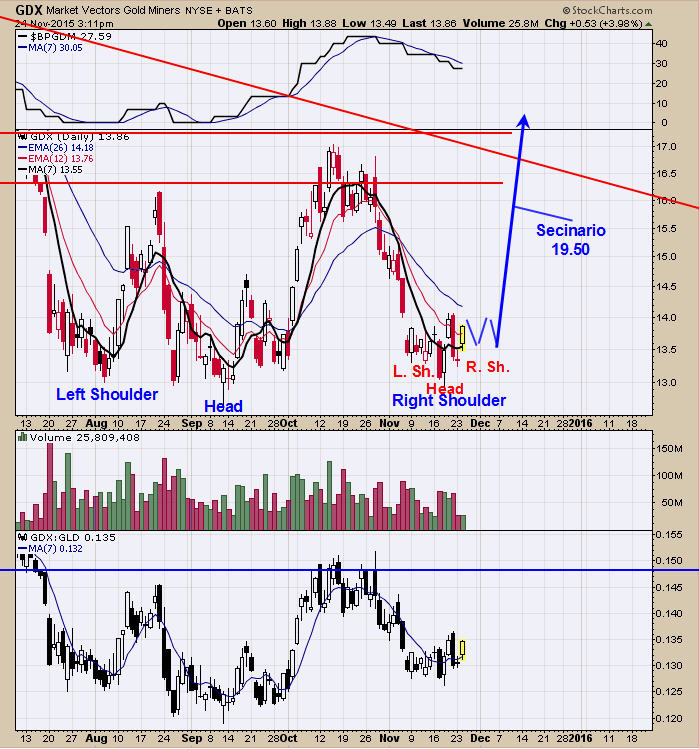
The Commercials short position reported last Friday came in at -28,473 and readings below -50K are a bullish sign for gold. When the Small speculator come in at a net short position would add to the bullish picture and they came in at net short 5926 contracts. The September 11 low appears to be the Head of a large Head and Shoulders bottom where the early August low was the Left Shoulder and the current time frame is developing the Right Shoulder. The potential developing Right Shoulders is forming a smaller Head and Shoulders bottom where the November 17 “Shakeout” is the Head. If this is a smaller Head and Shoulders pattern developing than market may trade sideways for a couple of days to create the “Right Shoulder” which could run into early December. So far the smaller and bigger Head and Shoulders pattern look promising. The larger Head and Shoulders bottom (Head is the September 11 low) has an upside measured target to 19.50. Long GDX on 11/20/15 at 13.38.
Tim Ord,
Editor
For examples in how "Ord-Volume" works, visit www.ord-oracle.com. New Book release "The Secret Science of Price and Volume" by Timothy Ord, buy on www.Amazon.com.