
Monitoring purposes SPX: long SPX on 11/2/15 at 2104.05
Monitoring purposes GOLD: Long GDX on 11/20/15 at 13.38.
Long Term Trend monitor purposes: Flat
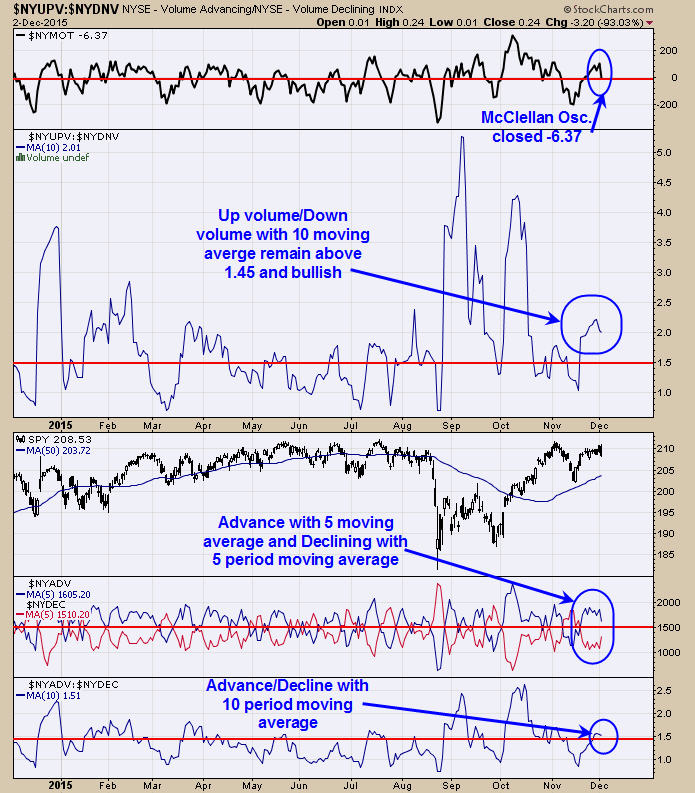
The chart above helps to find the momentum direction of the market. The top window is the McClellan Oscillator which closed at -6.37 and below “0” and a bearish sign. Next window down is the Up volume/Down volume with a 10 period moving average and readings above 1.45 are bullish for the market and today’s reading came in at 2.01. Bottom window is the Advancing issues/Declining issues with 10 period moving average and reading above 1.45 are bullish and today’s reading finished at 1.51. Next window up is the Advancing issues with 5 period moving average and Declining issues with 5 period moving average and this indicator remains on a bullish crossover. Of the four indicators on this page three remains bullish and suggests the uptrend is intact. We will see what tomorrows trading brings. Follow us on twitter https://twitter.com/ordoracle.
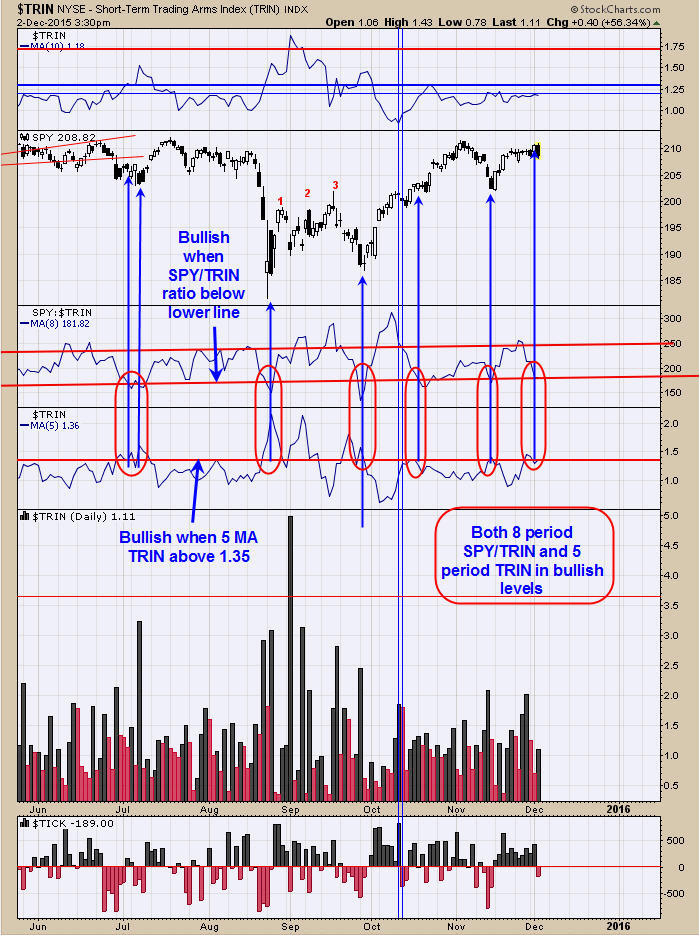
We have updated this chart from yesterday. We have different parameters for the SPY/TRIN ratio as they represent different timeframes in the market. Above is the 8 period SPY/TRIN ratio which represent the shortest timeframe and helps with the short term signals. Yesterday and today the 8 period SPY/TRIN ratio and the 5 period moving average of the TRIN reached the bullish levels suggests a low is near by. Today’s San Bernardino Shootings could have “spooked” the market short term and we will have to wait and see if it has a lasting effect.
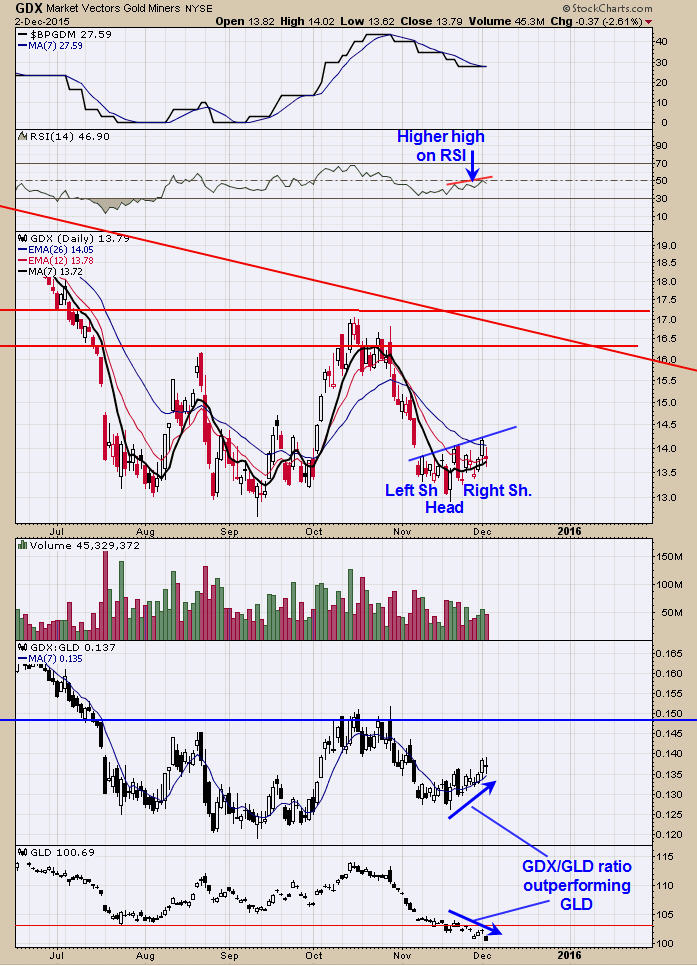
The COT report for November 27; Commercials short position 11,983 contracts, over 50% drop from the previous week which came in at 28,475 contracts. We reported yesterday commercials COT reading at 24,465 which was incorrect. The Small speculator short 4498 contracts (modest change from 5926 previous week) remains correct. The corrected COT report for Commercials is even more bullish for gold and suggesting a good bottom is forming in this region. Since early November, GDX appears to be forming a bullish “Head and Shoulders bottom”. The RSI has made a higher high as GDX has made a higher high over the last couple of weeks confirming GDX rise. Notice that the GDX/GLD ratio is rising and GLD has been moving lower of the last couple of weeks showing Gold stocks are outperforming Gold and a bullish sign for both gold and gold stocks. For now the picture remains bullish for both gold and gold stocks. Long GDX on 11/20/15 at 13.38.
Tim Ord,
Editor
For examples in how "Ord-Volume" works, visit www.ord-oracle.com. New Book release "The Secret Science of Price and Volume" by Timothy Ord, buy on www.Amazon.com.