
Monitoring purposes SPX: long SPX on 11/2/15 at 2104.05
Monitoring purposes GOLD: Flat
Long Term Trend monitor purposes: Flat
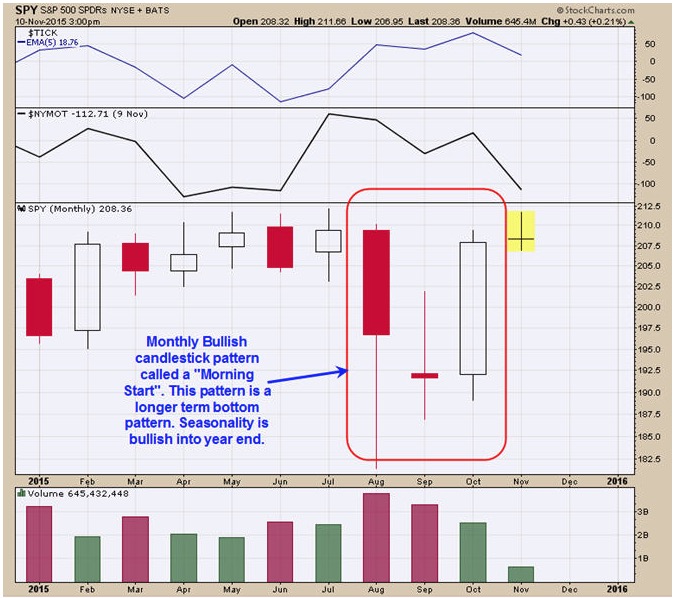
The chart above is the monthly SPY. The chart pattern that formed form the August low to the October rally was a Candlestick pattern called a “Morning Start”. The “Morning Star” pattern is a longer term bullish pattern and suggests a meaningful bottom in the SPY is in place. Seasonality is bullish into year end and market could see new highs. The bigger picture remains bullish Long SPX on 11/2/15 at 2104.05.
Follow me on twitter https://twitter.com/ordoracle.
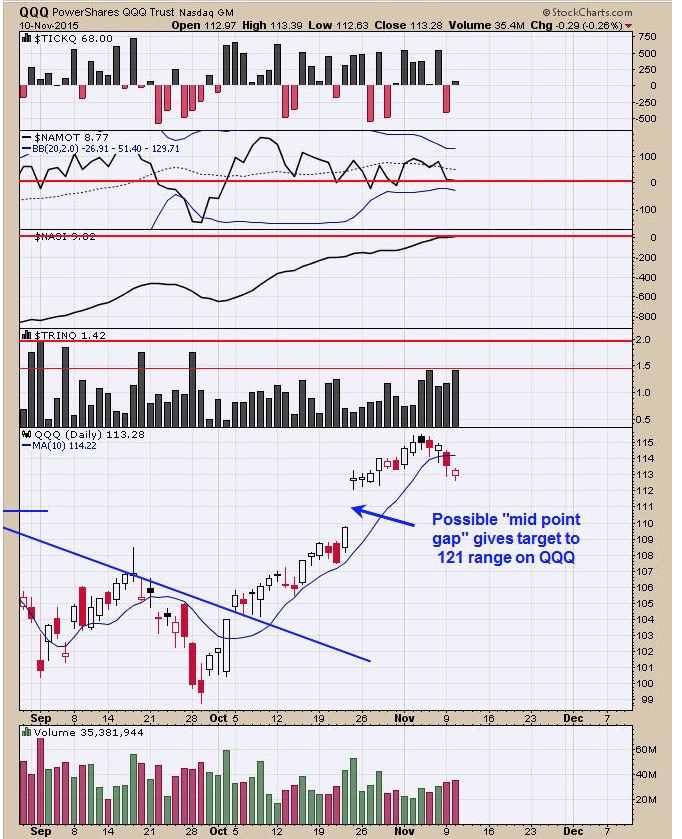
A large gap formed on October 23 and this gap could be a “Mid point gap” (gap that forms at the mid point of the move). If indeed the October 23 gap is a mid point gap, than a measured projection can be determined and in this case would give a target near 121 on the QQQ which is over 7% higher from here. We don’t have it shown but the August 24 on the QQQ could have been the Head of a Head and Shoulders bottom. By measuring the bottom of the Head to the Neckline and projecting that number from the Neckline break in early October would give a measured target to 130 range on the QQQ. The QQQ appears to be leading the way as it has already broke to new highs and the SPY is still below its previous highs. Seasonality remains bullish for the next two month and new highs in the SPY along with the QQQ is likely. Free 30 day trial, send request tim@ord-oracle.com.
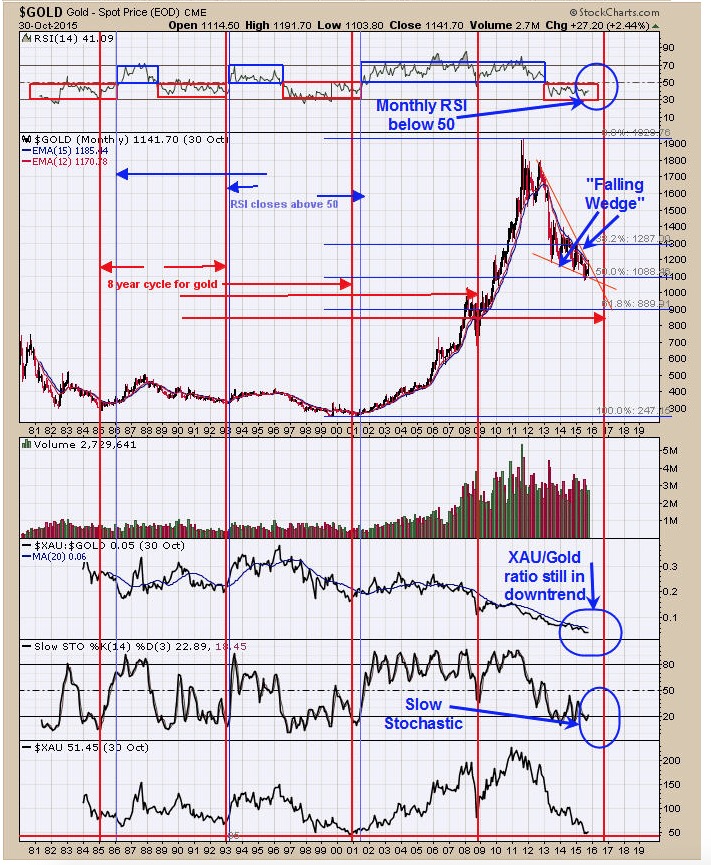
The above monthly gold chart goes back to 1980. The red vertical lines are eight year cycle lines that show gold bottoms every eight years (give or take a month or so). The next major cycle low is due November 2016, one year away. We don’t have it shown but gold also bottom in 1977 and add eight years and the next low was due in 1985 and right on time. We are keeping on eye on the larger picture but so far none of the major indicators are showing bullish signs. The top window is the monthly RSI and it remains below 50. A close above 50 would be a bullish sign. The monthly Slow Stochastics is oversold but showing little strength. The monthly XAU/Gold ratio is still trending down in a bearish manner but is very oversold with a reading of .05. Historically a reading of .05 is considered very low and shows gold stocks are cheap compared to the price of gold. History shows gold stocks are cheap compared to gold when XAU/Gold ratios is below .10. Gold has been choppy down since mid 2013 forming a “Falling Wedge” and this chop could continue into late 2016. Still neutral for now.
For examples in how "Ord-Volume" works, visit www.ord-oracle.com. New Book release "The Secret Science of Price and Volume" by Timothy Ord, buy on www.Amazon.com.
Tim Ord,
Editor