
Excerpts from our current issue
Rationales & Targets
TrimTabs recently reported that corporate insiders jettisoned $7.6 billion worth of shares, the second highest monthly total of the year and the fourth-highest in the last three years. Why would anyone be surprised? There’s no way current valuations can be justified and insiders know that best of all. Even if one were to conclude that cyclically adjusted price/earnings (Shiller’s CAPE) ratio of 20 was fair, stocks would be more than 30% overvalued. Interestingly, that would equate to Dow 12,600, quite far beyond even our bear forecasts.
Despite the savvy insiders, corporate treasuries have not only been buying all the shares dumped by insiders but have ratcheted up to buy more. Lots more. Thus far in 2015, U.S. firms have spent roughly $1.37 trillion on company buybacks and takeovers—a record, of course. Buybacks mean less shares outstanding, which means higher earnings per share, which means results may not be as good as they appear. Ironically, the buybacks also enable companies to issue even more shares via stock option plans to renew the cycle of insider sales. Does this sounds like a racket?
If insiders are all that anxious to sell out, perhaps the stuff is about to hit the fan. At some point, we will need to see the August 24th low of Dow 15,370 tested. It would be a horrible way to begin 2016 but we’re convinced it will happen before the end of April.
Make No Mistake, It's A Mania
- A free three issue trial to Crosscurrents is available upon request -
The Federal Reserve established Reg. T in 1934, allowing the Fed to set initial and maintenance rates for margin. After stocks had collapsed by half in the punishing bear market of 1973-1974, the margin rate was lowered from 70% to 50% by the Fed, ostensibly to support prices. The FRB has not acted since then, despite having ample opportunity to stifle excessive speculation in 1987, 2000 and 2007. Even when Fed Chairman Alan Greenspan pondered the question of “irrational exuberance” in December 1996, the Fed sat by idly and refused to budge, explaining that speculators could easily borrow money to buy stocks with home equity loans and credit lines from credit cards and the like. Since it was already a time of easy money, the Fed argued it had no clout and thereby missed a huge opportunity to make an emphatic statement that excessive speculation could be ruinous. You need go no further to understand why we are now in the midst of our third veritable stock market mania in 15 years.
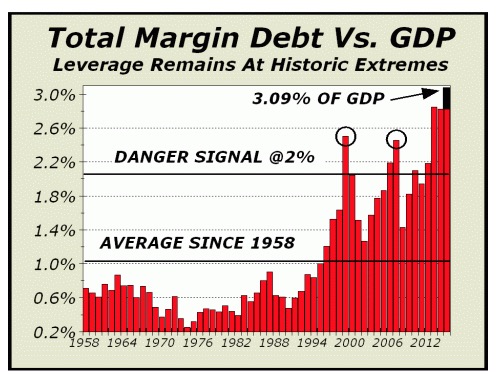
Total margin debt expanded nominally in November to $515.41 billion, the seventh highest monthly reading ever. Of course, what makes this distinction scary is that the six highest readings were from March to August of this very same year. For those who argue that margin debt is typically a lagging, rather than leading indicator, we would argue that manias are as far from normal times as it gets. Margin debt peaked precisely with prices in March 2000 and peaked three months before prices in July 2007. Over the life of our chart, margin debt has averaged just over 1% versus gross domestic product (GDP) and as the additional black bar reveals, margin debt was as high as 3.09% of GDP at the end of April, by far the highest since 1929. The indicator is currently at 2.86%, which will represent the highest year end reading in 86 years, if maintained through the last three days of December. This is not merely an excessive level of debt, it is a disaster waiting to happen.
For more information, please contact us:
Alan M. Newman, Editor, Crosscurrents
516-557-7171
www.cross-currents.net