
How to Use and Interpret a Center Line Oscillator
A Center Line Oscillator Moves in Opposition to Price
Most Technical and Retail Traders are familiar with high and low range oscillators or what is often called an Overbought or Oversold Oscillator. However few really understand or use a Center Line Oscillator which is extremely useful during volatile market conditions, when giant to large lot Market Participant Groups are trading the opposite side of the market from smaller lot Market Participant Groups which is what creates volatility most of the time.
Understanding the relationship between the larger lot institutional activity and the small lot activity of the retail crowd, helps guide traders towards trading with the larger lots rather than against them. This reduces whipsaw losses, weaker trades, and frustration.
At all times Technical and Retail Traders should know which Market Participant Groups are in control of price, as this information relates to how price will behave in the near term for Intraday, Day, Swing, and Position Trading.
Today we will study the Chaikin Oscillator ChiOsc is a Center Line Oscillator, which has the ability to move in opposition to price. This is one of the key benefits of any oscillator that uses a center line. When using these oscillators Technical Analysts are not looking at Overbought versus Oversold conditions of price on the Short Term or Daily Trend. The use of a center line in an oscillator indicator is to determine and reveal whether the power behind the price action is on the buy side or sell side. This creates a negative divergence, whenever the giant to larger lot Market Participant Groups are trading the opposite side of a trade from the Retail or Smaller Lot Traders.
The stock chart example of The Walt Disney Company (NYSE: DIS) below is an excellent example of how this indicator can warn early that giant to larger lots are selling down.
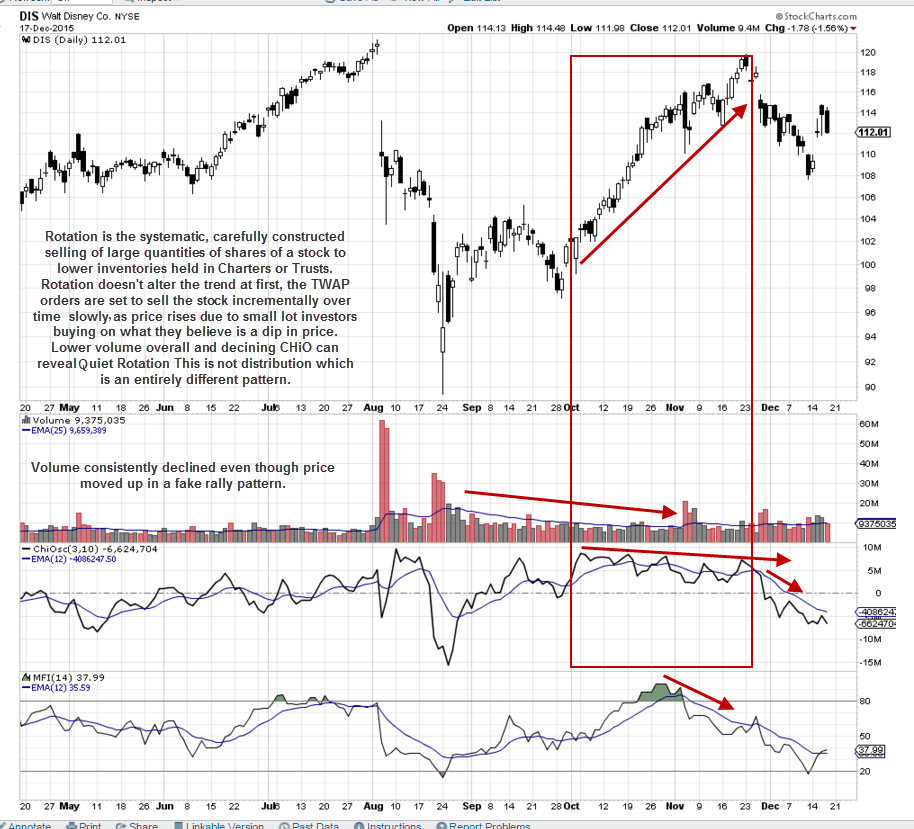
This was actually Quiet Rotation™ activity during October and November, when smaller lots and High Frequency Trading HFT speculation drove price upward on declining Volume. Giant and large Institutions were consistently and steadily rotating out of DIS, slowly and regularly selling shares as smaller lots were buying on what they assumed was merely a dip.
Quiet Rotation™ patterns from giant and large lot Institutions selling are very tough to see unless you use indicators that move contrarily to price. Most Momentum Price Indicators move in harmony with price, lagging slightly behind it.
The ChiOsc Indicator with a standard Stock Charts.com setting and an Exponential Moving Average EMA to aid in the interpretation, clearly shows that giant to larger lots were selling into the retail crowd rally of October and November. In other words the giant and larger funds wanted to sell inventory they held of DIS, to reduce their risk as the company financials indicated a business cycle contraction. They hid their selling by waiting for DIS to move up, then started steady Time Weighted Average Price TWAP rotation automated orders, triggering regularly as price moved upward.
It is clear to see that the ChiOsc Indicator is moving down while price is moving up, which is a huge negative divergence. When Technical and Retail Traders are able to use a Center Line Oscillator indicator properly, they can improve their profitability and consistency of success trading stocks short term.
Summary
Understanding why a rally fails is important. This rally was never going to succeed and here are the reasons why:
- Volume declined as price moved upward
- Smaller lots and not giant to larger lots were moving price up
- Giant funds were selling into the rally regularly
Adding a couple of additional indicators to your favorites can dramatically improve your trading results.
Trade Wisely,
Martha Stokes CMT
www.TechniTrader.com
info@technitrader.com