Monitoring purposes SPX: long SPX on 11/2/15 at 2104.05
Monitoring purposes GOLD: Long GDX on 11/20/15 at 13.38.
Long Term Trend monitor purposes: Flat

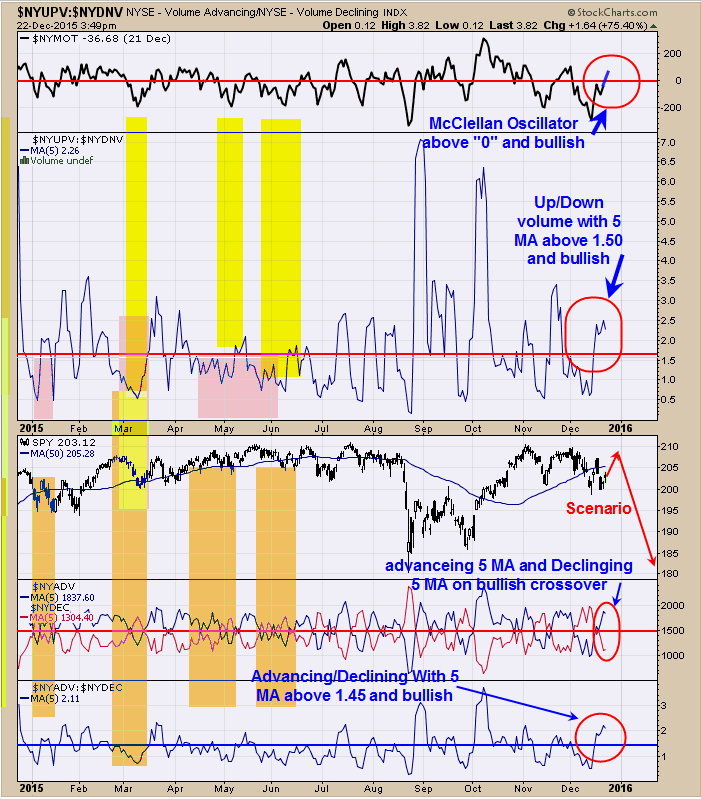
Seasonality remains bullish into the first week of January. The AAII Bulls/AAII bears stands at .61 and short term bullish. Above are short term gauges for the market. The top window is the McClellan Oscillator which closed near +50 and above “0” and short term bullish. Next window down is the Up volume/down volume ratio and remains above 1.50 and bullish. Bottom window is the Advance/Decline with 5 period moving average and readings above 1.45 are bullish and today’s reading came in at 2.11. Next window up is the Advancing issues with 5 period moving average and Declining issues with 5 period moving average and this indicator remains on a bullish crossover. All four indicators are in bullish territory and suggest the short term rally should continue. Short term the market could attempt to test last Thursday’s high near 208 on the SPY.

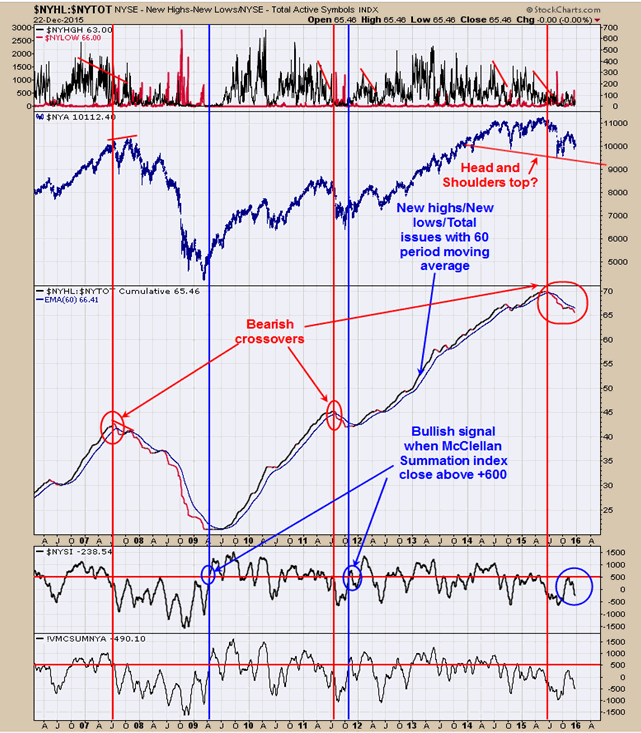
Another longer term view of the market. This chart dates back to 2006. Longer term bearish signals are triggered when the NYSE New highs/New low/Totals issues traded crosses below its 60 period moving average. The red vertical lines show these bearish signals. As you can see a signal was triggered back in May. To change the market back to a bullish signal the NYSE McClellan Summation index needs to trade above +600. Current Summation index reading is -238. To change the bearish scenario, a strong rally needs to begin now and push the McClellan Summation index back above +600. Follow us on twitter https://twitter.com/ordoracle.

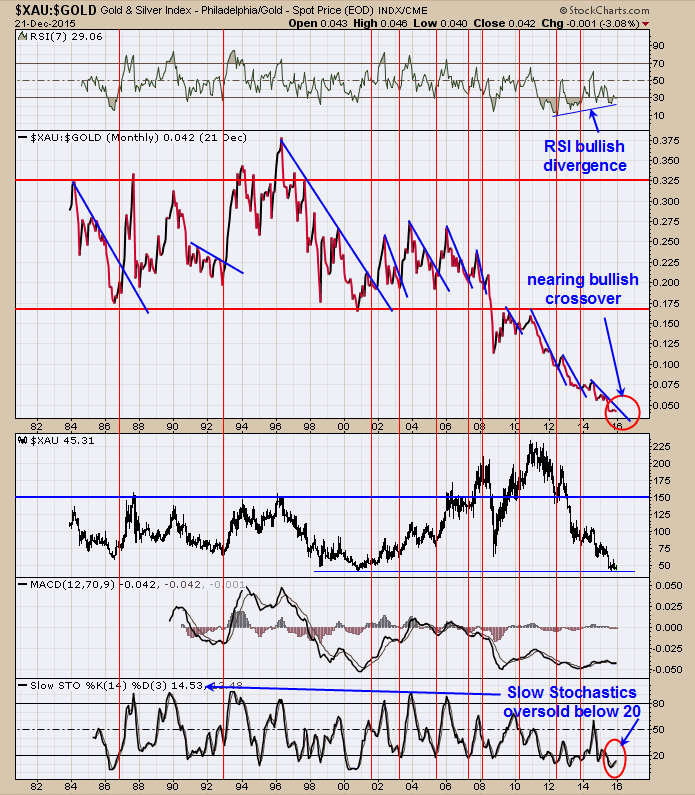
The Gold Commercials came in at -8266 at the last report and previous week reading was -13,997 showing the Commercials have increased their bullishness. The chart above is the monthly XAU/Gold ratio going back to 1981. When the XAU/Gold ratio is rising than Gold stocks are outperforming gold and a bullish condition for both gold stocks and gold. The red vertical lines show when this ratio starting advancing which in turn showed when the XAU started its rally phase. In General this ratio has been in a downtrend since 2011 and so far has not turned up any lasting manner. The RSI and this ratio are showing a bullish divergence along with the Slow Stochastics in oversold conditions suggests downside is limited. For this ratio to turn bullish would require the ratio to jump above its blue down trend line as well as the slow Stochastics to close above 20 and the RSI to close above 50. These monthly indicators are in bullish regions but have not turned up. Another month of sideways to up on the monthly XAU/Gold ratio could turn these indicators bullish. Long GDX on 11/20/15 at 13.38. For examples in how "Ord-Volume" works, visit www.ord-oracle.com.
-Tim Ord
www.ord-oracle.com
