
Monitoring purposes SPX: Long SPX on 2/19/16 at 1917.78.
Monitoring purposes GOLD: Neutral
Long Term Trend monitor purposes: Short SPX on 1/13/16 at 1890.28
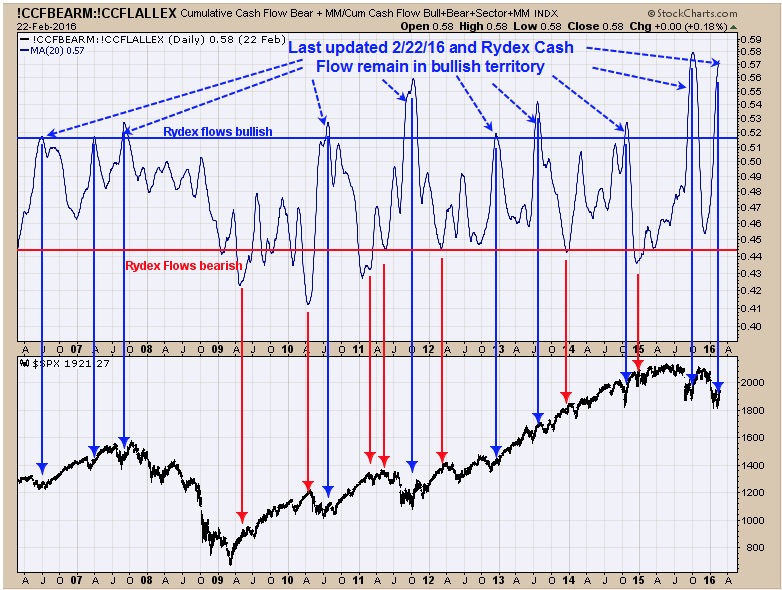
Above is the Rydex bull and bearish cash flow. When investors are running to the bear fund to a high degree and exiting the bull fund to a high degree, which is a bullish condition for the market. The above chart goes back to 2006 and measures what the Rydex investors is doing. The blue arrows show when the Rydex trader is hugged to the bearish side and in most cases the market is near a low. This chart works well find lows in the market and not as well finding highs which are the red arrows. However as of now these Rydex traders are showing a bullish condition for the market.
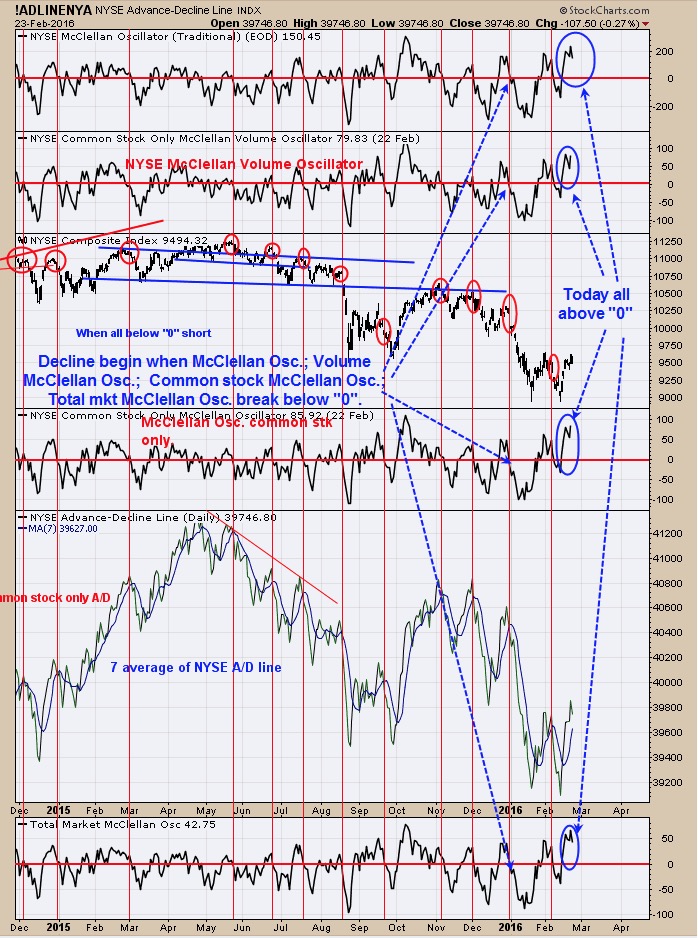
Decent declined in market can begin when the McClellan oscillator, Volume McClellan Oscillator, Common stocks only McClellan Oscillator and total market McClellan oscillator break below the “0” line. The red vertical lines show when these condition are met. As of today are Oscillator are well above “0” and suggests the rally has further to go. If for some reason all the Oscillators break the “0” near term (unlikely) we will exit or long position. Normally when the McClellan Oscillator gets +200 above (which it did), this condition shows short term strength in the market and suggests the rally will continue after the consolidation is completed. Short term trend of the market appears up; next resistance is near 200 on the SPY (SPX near 2000). Long SPX on 2/19/16 at 1917.78.
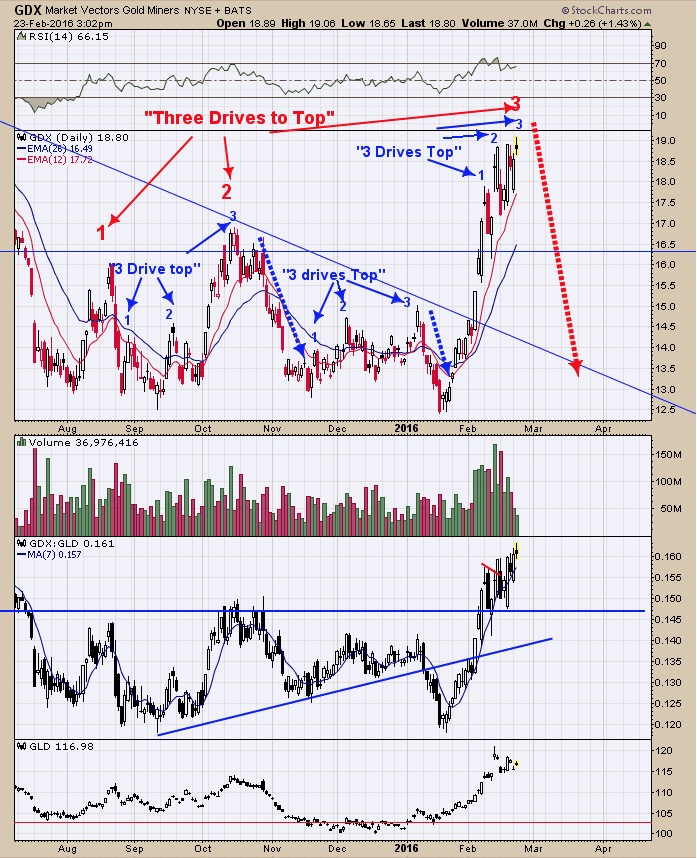
The Gold Commercials came in at -131984 as of 2/19/16; previous week reading was -104,923. COT commercial readings above -130K short range can produce tops in Gold and yesterday’s COT chart proved that point. The chart above is the GDX going back to July 2015. We have said is the past that a pattern can repeat itself form a smaller pattern that is also in a larger pattern. A “Three Drive to Top” pattern formed from late august into the October top. The reason we know it’s a “Three Drives to top” is that it pulled back down to where the pattern began and that is what “Three Drive to Top” pattern does. From the low in November another “Three Drive to top” formed again which pulled back again to where the pattern began. Form that low, GDX has rallied making a third higher high going back to August 2015 high which again appears to be drawing a large “Three Drives to Top” which again has a downside target to where pattern began and in this case would have a target near 13.00. Notice that over the last couple of weeks that a small “Three Drives to Top” is forming now and it appears a third leg up has started. We will see how far the “Third leg” will push and then will consider a short position.
Tim Ord,
Editor
For examples in how "Ord-Volume" works, visit www.ord-oracle.com. New Book release "The Secret Science of Price and Volume" by Timothy Ord, buy on www.Amazon.com.