
Excerpts from the March 28th issue
Rationales & Targets
We expected another flash crash in March but it hasn’t happened....yet. Of course, with just a few days to go, the odds now appear remote and we can accept that. However, the quick return of the VIX Volatility index to the lowest levels since last October bears witness to one of the greatest episodes of complacency and optimism since the bear bottom of March 2009. Episodes such as this are typically countered by opposite extremes. Although the VIX traded as high as 32 in January and 31 in February, those levels are not in the slightest indicative of the kind of extreme pessimism we might see at a significant price bottom. We still see an appointment with the 40 level, seen last August, as a certainty.
Our next issue will focus on seasonality as we do twice each year. For decades, you could split the year neatly in half. From November through April, stocks were great, averaging annualized gains of 14%. However, from May through October, stocks averaged no gains at all. In recent years, these patterns have changed significantly and our analysis now shows the unfavorable months last from May through the end of the year. We see no reason for the pattern to change this year. The confluence of potential negative catalysts include a significant slow down in economic growth and great concern about where the country might be headed for the next four years. Given the Dow is lower since the favorable period commenced on November 1, 2015, we’re not at all sanguine.
More Negative Divergences
- A free three issue trial to Crosscurrents is available upon request -
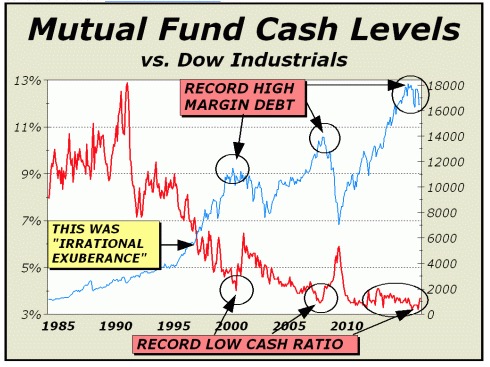
By the end of January, the actual cash levels of equity mutual funds fell to their lowest since August 2013, when net inflows were still strongly positive. However, while net inflows for all equity funds totaled over $109 billion for the 12 months of August 2013 to July 2014, net inflows for domestic equity funds during that same period was minus $15.6 billion. That’s an amazing dichotomy and speaks directly to how overvalued U.S. stocks have been for way too long. Since total margin debt increased by $84 billion, we can see net demand for stocks was nevertheless roughly $68.4 billion, the primary reason the S&P 500 was able to climb over 15%.
At bottom, it is clear that the third pair of highlighted areas are at least as significant as the prior two in 2000 and in 2007. Record peaks in margin debt and record low cash-to-assets ratio equates to tremendous risk ahead. Clearly, they were danger signals. Combine those danger signals with yet another mania for stocks and one can easily see the potential for another dramatic unraveling. For those who would argue against our characterization of another mania in progress, the comparison to 2007-2008 need only include Shillers 10-year cyclically adjusted P/E ratio (CAPE), which remains near enough to all time highs to strongly suggest a bear market is on the horizon (see http://www.multpl.com/shiller-pe/). At 25.9, CAPE is 55.6% above the mean and 61.7% above the median dating back 135 years to 1880.
Of course, if the economy was racing full steam ahead, perhaps we could make the case that corporate earnings would improve and a higher rate of growth in GDP could support higher prices. However, as we suggested earlier, “the present bulge [in GDP growth] is likely the best we will see.“ Further, we are readily able to support that statement with our charts for Industrial Production and Consumer Sentiment shown on this page.
Federal Reserve Economic Data, known as FRED, publishes series for 66 major categories dealing with the economy. Industrial Production is of course, one of the most important, measuring the real production output of manufacturing, mining, and utilities. We note the severe downturn from the 2007 twin bubble stock/housing peaks into the 2009 recession low and the subsequent climb to a peak only narrowly higher than in 2007. Moreover, the behavior of the index since the December 2014 peak is troubling. A rather ordinary pullback presented no problem, but the next rally failed to establish a new high and the subsequent decline to a lower low into December 2015 has now set the stage for disappointment. If the index now breaks below the December 2015 low, the possibility of a recession increases.
This view is borne out by a peek at Consumer Sentiment shown at top center. In our analyses, negative divergences are typically significant signals of impending trend reversals. Clearly, the turn in trend gave us a heads up about the markets in 2007. The negative divergence in place for over a year gives us additional confidence a recession is on the horizon. If the September 2015 low breaks at any point, the odds for recession will surge dramatically.
For more information, please contact us:
Alan M. Newman, Editor, Crosscurrents
516-557-7171
www.cross-currents.net