As part of my regular sector and industry review process, I like to use RRG charts to better understand sector and group rotation. I was surprised to see the airlines group rotating from the Lagging to the Improving. This means that although the group has been underperforming, the momentum is starting to increase.
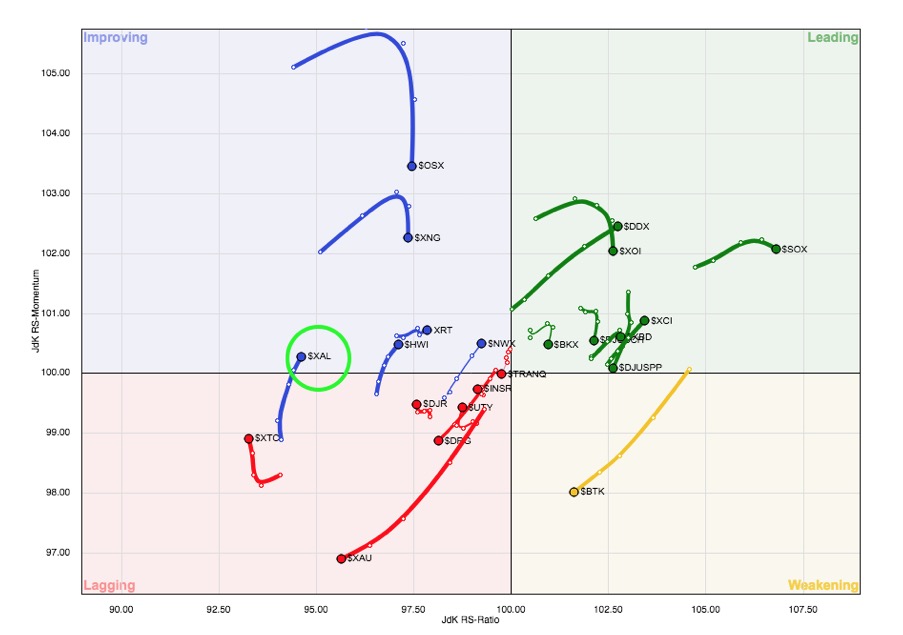
Let’s review a chart of the NYSE Arca Airline Index ($XAL) to see how that relates to the move on the RRG chart. Then we can dig deeper into some of the airline charts to understand the rotation in more detail.
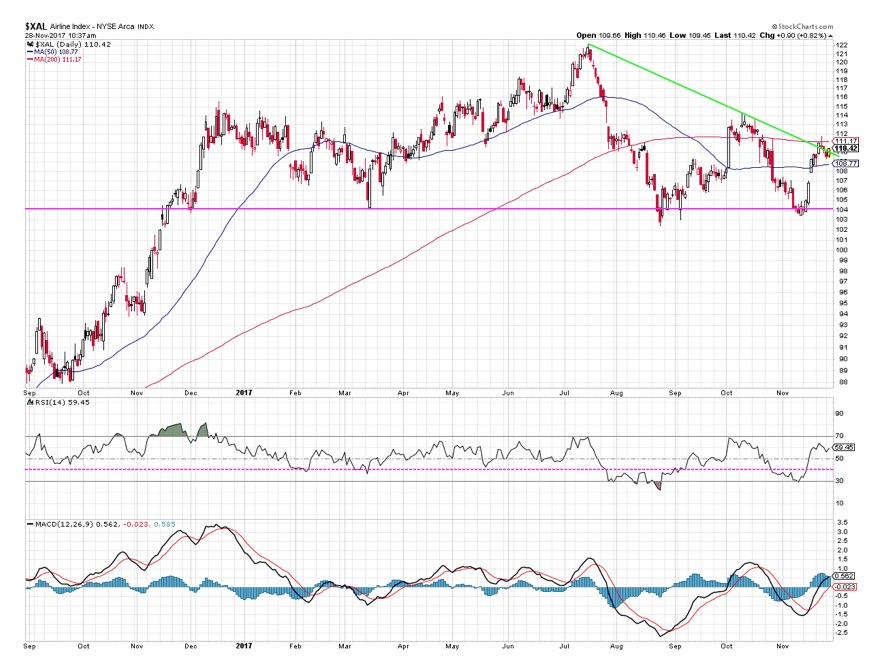
First off, the XAL recently found support at previous lows (solid pink line) then traded higher with a gap up. This lined up with the RSI moving below 40 (dotted pink line) and then back above, which often lines up with buyable corrections in bull markets.
The XAL then broke above a trend line using the price peaks in July and October (green line), and now is trading just below its 200-day moving average (red line).
Overall, the XAL appears to be in a fairly constructive technical pattern, bouncing off an established support level and potential breaking above the 200-day moving average in the near future.
Now let’s look at the members of the XAL index to see what’s driving this potential improvement in the chart.
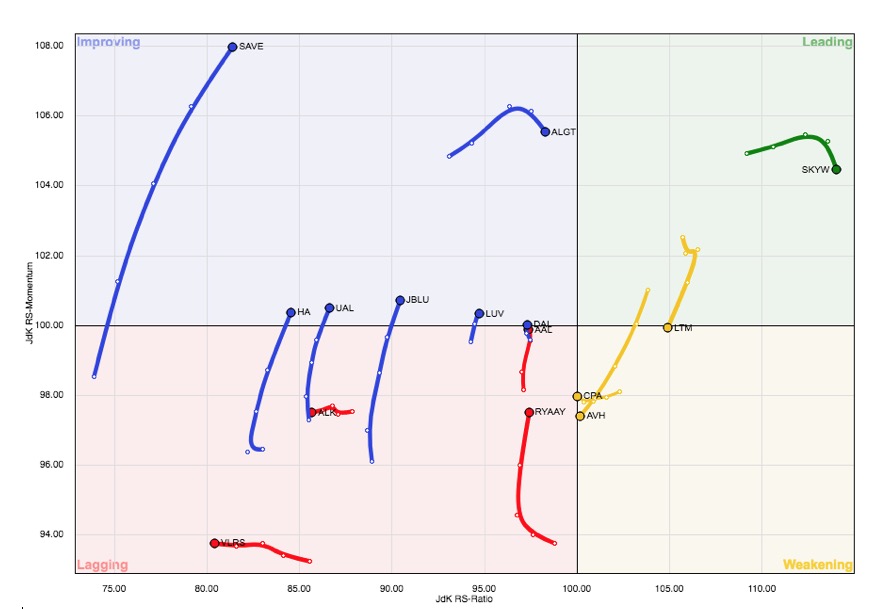 First off, I see that of the largest airline stocks (DAL, LUV, UAL, JBLU) are also now moving into the Improving quadrant. I’m also noticing three names (SAVE, ALGT, SKYW) that have the highest momentum readings on the RRG chart. Let’s dig into each of these charts.
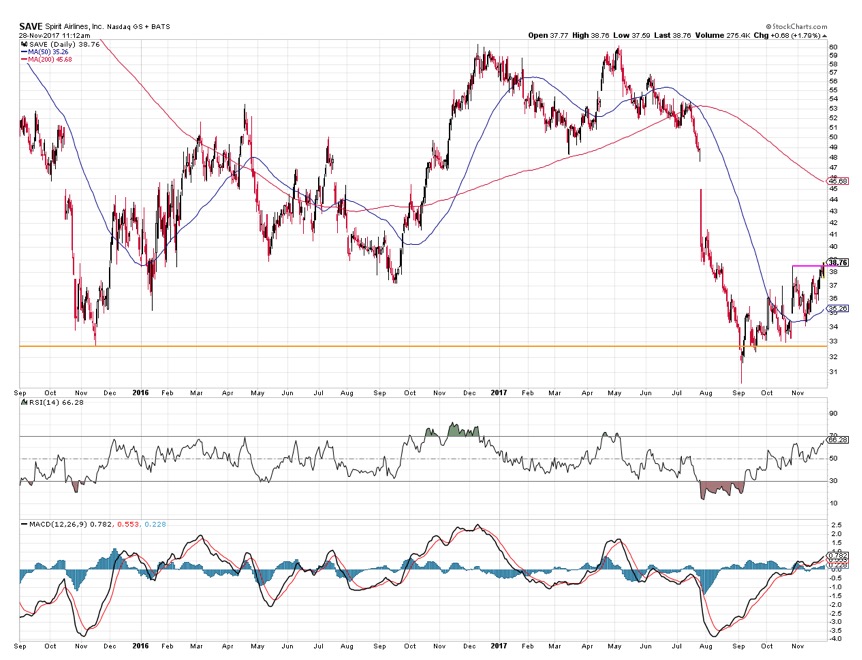
Spirit Airlines (SAVE) lost almost 50% of its value from a peak in May around $60 to a low of $30.32 in September. Looking at the last two years, you can see that this bottom lined up well with its low in 2015. Following a MACD buy signal in August, SAVE started a pattern of higher highs and higher lows as the RSI exited its oversold range.
SAVE recently broke to new 13-week highs after finding support at its 50-day moving average. From a technical perspective, this presents a fairly attractive risk/reward scenario with little resistance up to the 200-day moving average around $45.50.
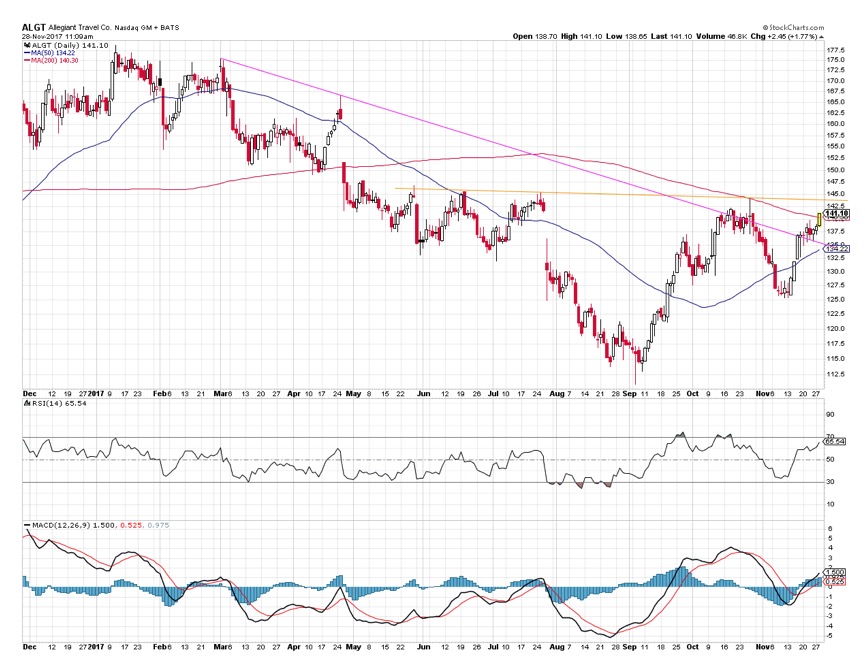
Allegiant Travel Co. (ALGT) has formed a potential inverse head and shoulders pattern, although that pattern is not yet confirmed. A confirmed break above the neckline (orange line) would confirm a breakout with upside to the long-term highs around $178. ALGT recently broke above a trend line using the March and April highs, and is close to confirming a break above its 200-day moving average.
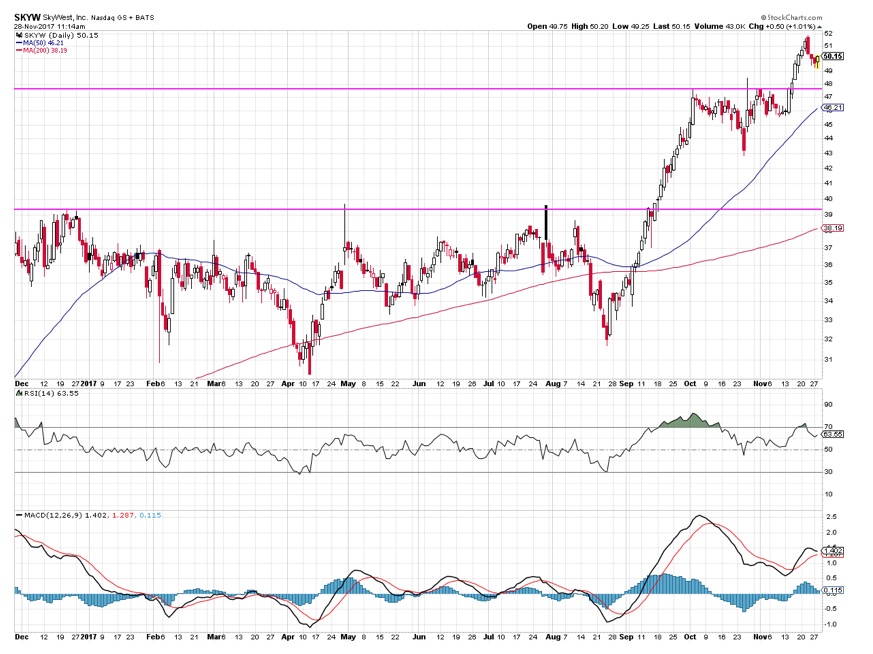
Skywest, Inc. (SKYW) has been the strongest performer from an RRG perspective, and the chart shows why that is the case. Back in September, SKYW broke above $39.50, which had served as resistance for most of 2017. The stock recently had another short-term breakout above the October highs and has now pulled back from a bearish engulfing pattern.
The SKYW chart is a great reminder of why a visualization like the RRG chart can be so valuable. Here is a stock that is an outlier in the group, in a clear and confirmed uptrend within a group of stocks that are in very different price configurations. By starting with the RRG chart then digging deeper into the component charts, you can uncover unexpected hidden gems.
David Keller, CMT
President
Sierra Alpha Research LLC
David Keller, CMT is President of Sierra Alpha Research LLC, a boutique investment research firm focused on managing risk through market awareness. He is a Past President of the Market Technicians Association and currently serves as a Subject Matter Expert for Behavioral Finance. David was formerly a Managing Director of Research at Fidelity Investments in Boston as well as a technical analysis specialist for Bloomberg in New York. You can follow his thinking at marketmisbehavior.com.
Disclaimer: This blog is for educational purposes only, and should not be construed as financial advice. The ideas and strategies should never be used without first assessing your own personal and financial situation, or without consulting a financial professional.
