There haven’t been this many bulls around since the running at Pamplona in Spain over the summer. With over 63% of investors thinking that the markets are going higher and a mere 14% in the bear camp, (per Investors Intelligence Sentiment survey) we haven’t seen a sentiment spread of this magnitude since right before the ’87 crash.
This bullish euphoria is during a period when stock prices are seemingly hitting a new high every day. Last Friday, the Nasdaq posted its 61st record close for the year which matches the number that was reached for this Index during the dot-com bubble of 1999.
With current conditions being the same as the periods directly before 2 stock market crashes, it would be easy to get scared into thinking you should go to cash.
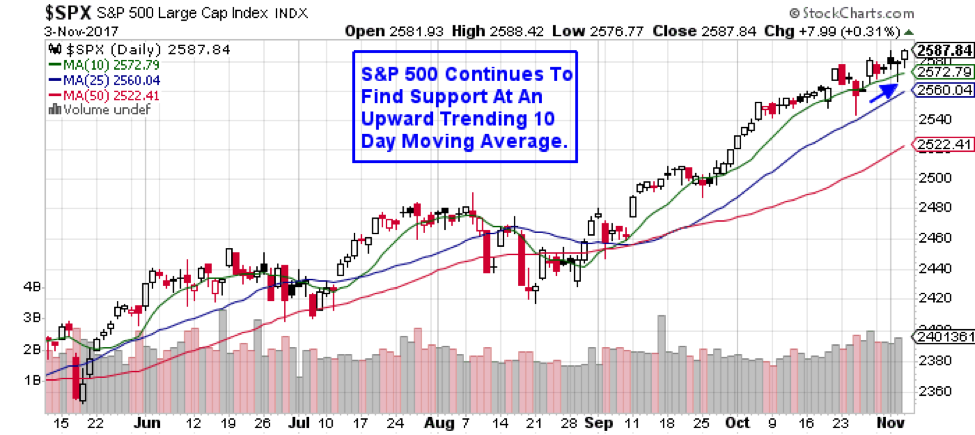
The exception would be investors who adhere to a set system that relies on trend analysis and technical indicators. These investors realize that as of this writing, the markets are in a confirmed uptrend with more near-term upside potential. Just look at the marked-up chart below to see what I’m referring too.
 That said, there is rampant speculation that the end is near with economist’s starting to make bearish noises. Three weeks ago, Goldman Sachs Global Equity chief put out a post that they were seeing signs of a market top. Using an indicator that looks at factors such as stock valuations, unemployment and inflation, their report pointed to a 67% chance that things were going to turn bearish over the near term. Other prominent Wall Street pundits are also making similar statements about the markets being on the verge of collapse.
And while these pronouncements are interesting, no amount of educated guesses will take the place of using a proven system that looks at daily market action to determine a top. One such system was developed by William O’Neil - the founder of Investors Business Daily. Using historical precedence of the activity leading up to prior stock market tops, it was decided that one can track the current conditions in search of similar activity.
The reasoning is that the markets are a sum of the buying and selling decisions of millions of investors but when the Institutional money managers start heading for the exits, you need to pay attention. When these market-movers begin selling, they create what is called a distribution day. Counting these distribution days will help you uncover a market that is in trouble.
The full definition of a distribution day is a loss in a major index of at least 0.2% over the prior day’s volume. These distribution days are almost always a sign that Institutions are leaving the market. By keeping track of the number of these days that are clustered together and pairing that with the trend of the markets, one can be forewarned of a negative turn.
To be more exact, 4 or 5 distribution days over several weeks nearly always signals that stocks are headed for a downturn. The easiest way to keep track of this is to check on the volume of the major Indexes once it begins closing the day at a lower price.
You’ll also want to pay attention to the trend of the markets by keying in on the price relative to key moving averages. A break below the 10-day moving average would be your first negative signal and again, keep an eye on that volume. The next key moving average is going to be the 25-day followed by the 50-day mav. As the price breaks below these moving averages, the downward trend begins to take shape.
Like most systems, there is an art to the interpretation of the daily action in the sense that the markets may be able to endure more distribution days during that 3-week period provided that the uptrend (defined by those key moving averages) has not been broken.
So while highly paid economists will continue to raise their red flags as the markets march higher, as an educated investor with a solid system in place you can continue to remain in the markets during the current uptrend.
Mary Ellen McGonagle
President, MEM Investment Research