SPX Monitoring purposes; Sold SPX 7/24/18 & 2820.40= gain .57%; Long SPX 7/19/18 & 2804.49.
Monitoring purposes GOLD: Neutral.
Long Term Trend SPX monitor purposes;
Sold long term SPX 7/16/18 at 2798.43= gain 2.95%; Long 6/29/18 at 2718.37.

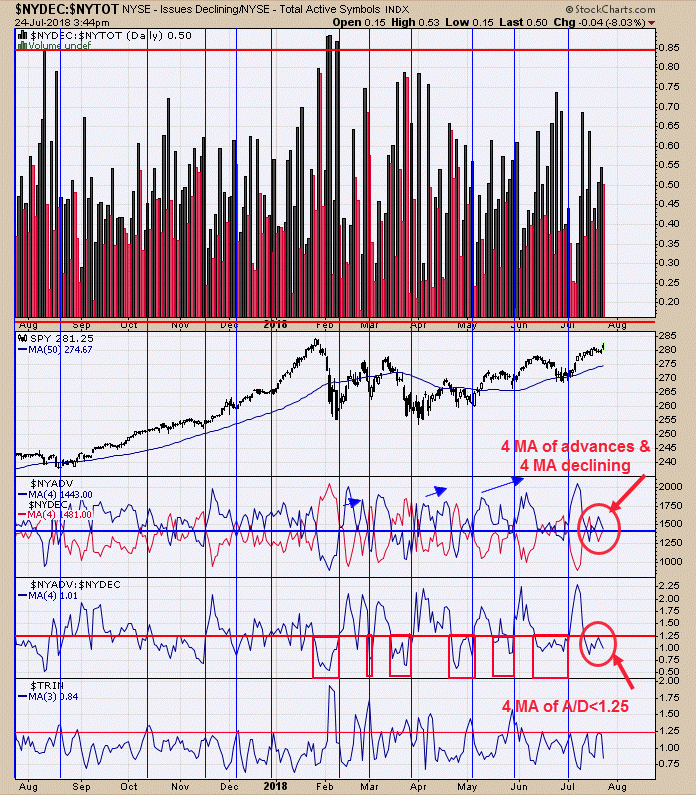
Second window up from bottom is the Advance/Decline with a 4 period moving average. Reading above 1.25 has been a bullish sign for the SPX; below bearish. Today’s reading came in at 1.01 even though the market has rallied the last couple of days; we take this as a bearish sign. Next window up is the Advancing issues with 4 period moving average and Declining issues with a 4 period moving average. When the blue line is above the red line, rallies usually occur and when red is above blue than declines can occur. Today both are near equal and that is after a rally; we take this as a bearish sign. There are January and February gaps (2825 to 2850 SPX range) and today’s high was 2829.99 near the targeted area. Market can back and fill here but not seeing signs (according to indicators on this page) that suggests the rally will continue. August and September could see weakness in the markets as seasonality is bearish in that timeframe. Sold long SPX on 7/24/18 at 2820.40= gain .57%; Long SPX on 7/19/18 at 2804.49.

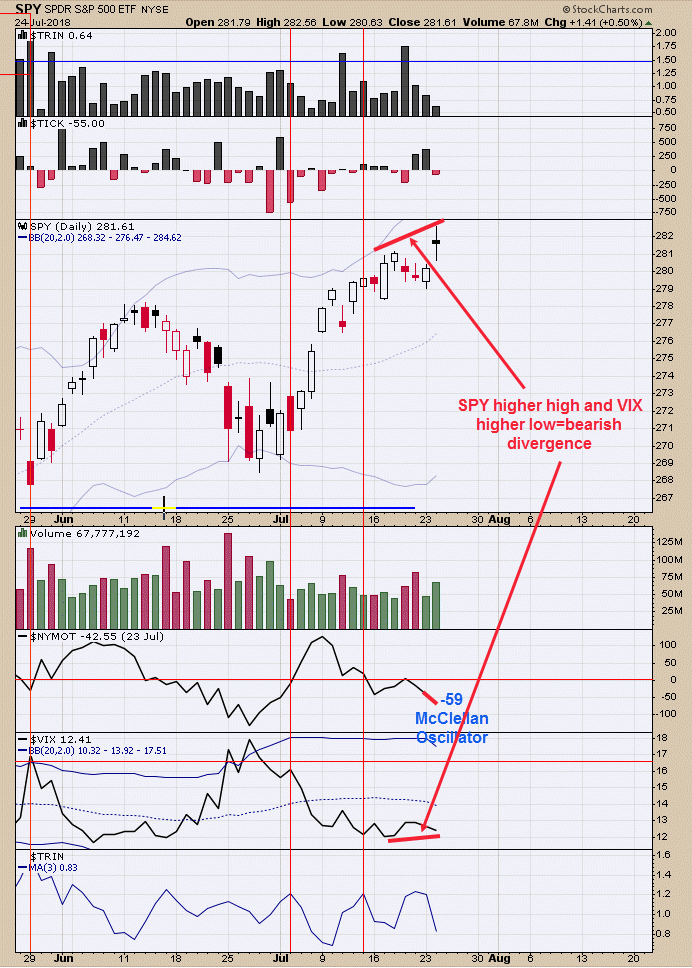
Form (@uskarlewitz); DIJA up 5 days in a row going into last Thursday. 72% up next day and 84% up within 5 days (today’s marks the fourth day and bingo). There are divergences in the VIX and McClellan Oscillator. First the McClellan Oscillator; today the SPY hit a new high going back to February and the McClellan Oscillator closed yesterday at -42 and down further today with a close of minus 59 showing the market is getting weaker. Today the SPY closed above last week high and the VIX made a higher low. Ideally for a bullish case, one would like to see the SPY making higher highs and the VIX make lower lows. There are divergences here and we elected to sell our long position and go back to sidelines.

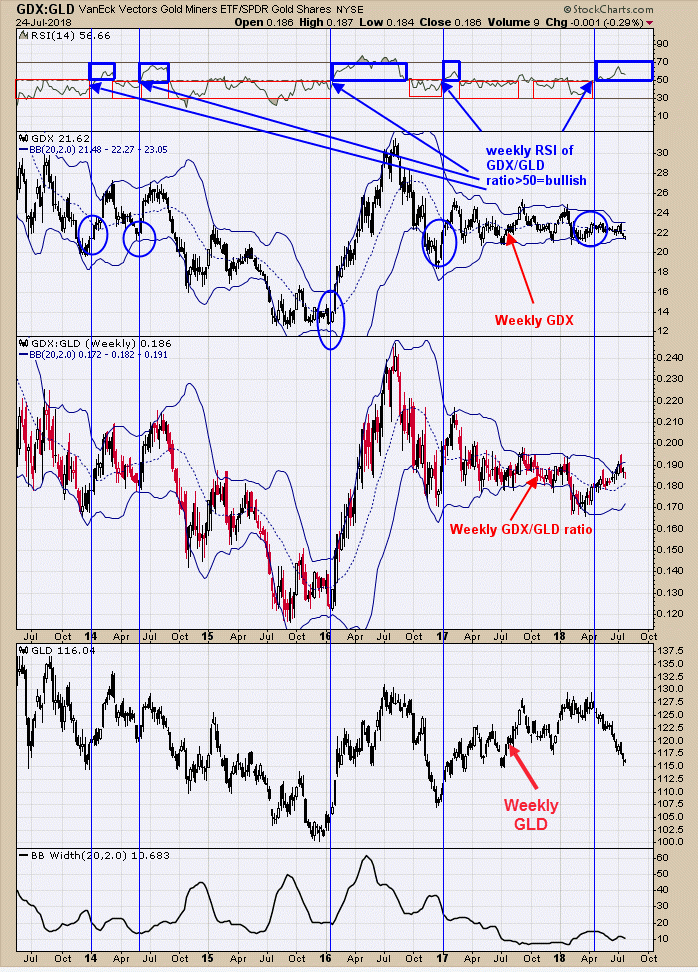
Daily momentum for GDX/GLD turned down yesterday as the RSI fell below 50. The above chart is the weekly GDX/GLD ratio with the weekly RSI in the top window. The weekly RSI remains above 50, closing at 56.66 today, showing that the weekly GDX/GLD ratio is still bullish and in an uptrend. A rising GDX/GLD ratio shows that Gold stocks are outperforming Gold and a bullish condition for both gold and gold stocks. The Gold commercials short position on the last report updated last Friday closed at 74K and the least short position going back to the December 2015 bottom. Major lows have formed in Gold when the Commercial position has been less than 100K. Market is still pounding out a low here but momentum needs to turn back up to get us long again.
Tim Ord,
Editor
Visit www.ord-oracle.com. New Book release "The Secret Science of Price and Volume" by Timothy Ord, buy on www.Amazon.com.
