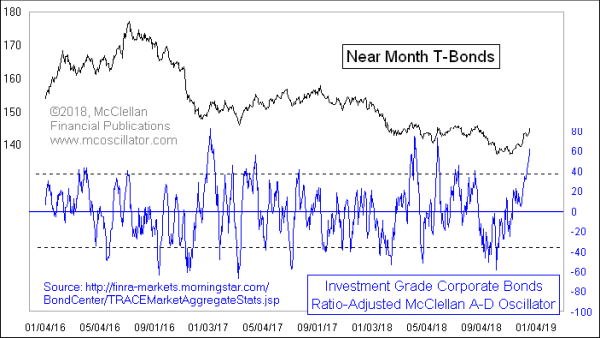
T-Bond prices have had a nice run upward since the lows in October and November 2018, but now we are seeing an important indication of a blowoff top, suggesting bond prices will not be able to continue higher from here.
The indicator in this week’s chart is a Ratio-Adjusted McClellan A-D Oscillator for high grade corporate bonds. The A-D data, as well as the determination of which bonds are high grade, is as provided by FINRA. See this article for a description of the difference between a Ratio-Adjusted McClellan Oscillator and the classic version.
Like the McClellan Oscillators for the NYSE and Nasdaq markets, this one for high grade corporate bonds tends to go positive in uptrends and negative in downtrends. It also can show us overbought and oversold conditions. Right now, we are seeing a really overbought reading, among the highest of the last 3 years.
A really high McClellan Oscillator for the NYSE tends to be an indication of strong initiation of a new uptrend and is usually not associated with the final price high. But it works differently for these bond A-D data. In the case of this one for high grade corporate bonds, the very highest readings like this are pretty uniformly associated with blowoff tops in T-Bond prices. The highest reading for this Oscillator may not coincide with the exact day of the final T-Bond price top, but it is in the right area.
Bond prices have surged higher as bond yields have fallen, and that drop in long term yields matches the drop in crude oil prices 3 weeks earlier, which is a principle I discussed here. Oil’s leading indication for bond yields has been a big feature in our Daily Edition recently, and it too agrees on the idea of a pause here for bond yields.
Tom McClellan,
Editor
The McClellan Market Report
www.mcoscillator.com
