
SPX Monitoring purposes: Sold SPX at 3327.71 on 2/7/20= gain 1.57%; long SPX on 1/28/20 at 3276.24.
Monitoring purposes GOLD: Long GDX on 1/29/19 at 21.96.
Long Term Trend SPX monitor purposes: Long SPX on 1/30/20 3283.66
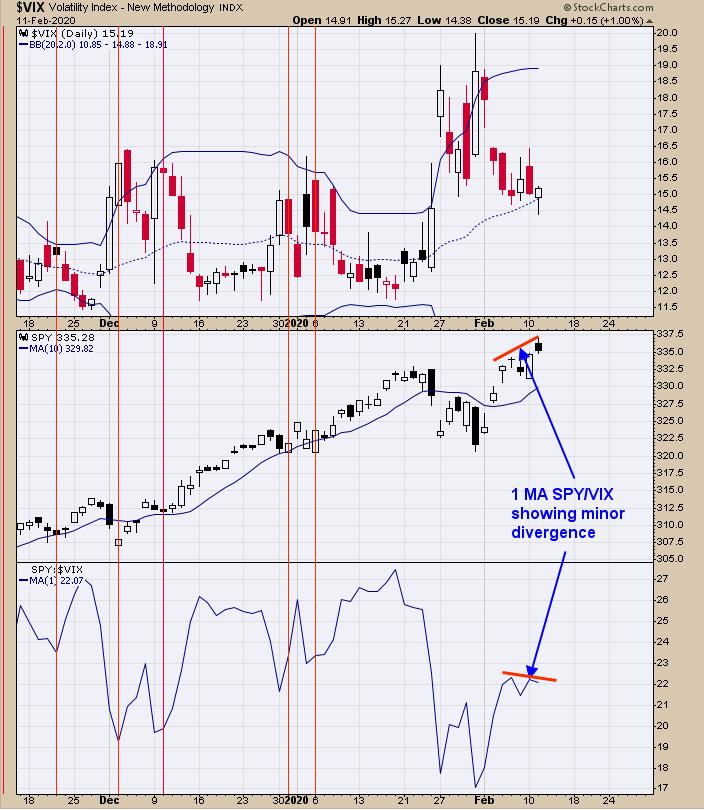
The bottom window is the 1-day average of the SPY/VIX ratio. This indicator has been good in finding the short-term direction of the SPY. When it diverges, then the SPY may be close to a reversal. Over the last several days, the SPY managed to move higher while the SPY/VIX ratio has made lower highs. Also, today the SPY closed at a new high and the ratio made a lower high; both conditions are a bearish sign. This is the week before option expiration and a week where whipsaws are common. The intermediate term appears bullish, but in the short term a retracement is possible. Expiration week looks to be an up week and, therefore, if the market does retrace short term, we will be looking for a bullish setup.
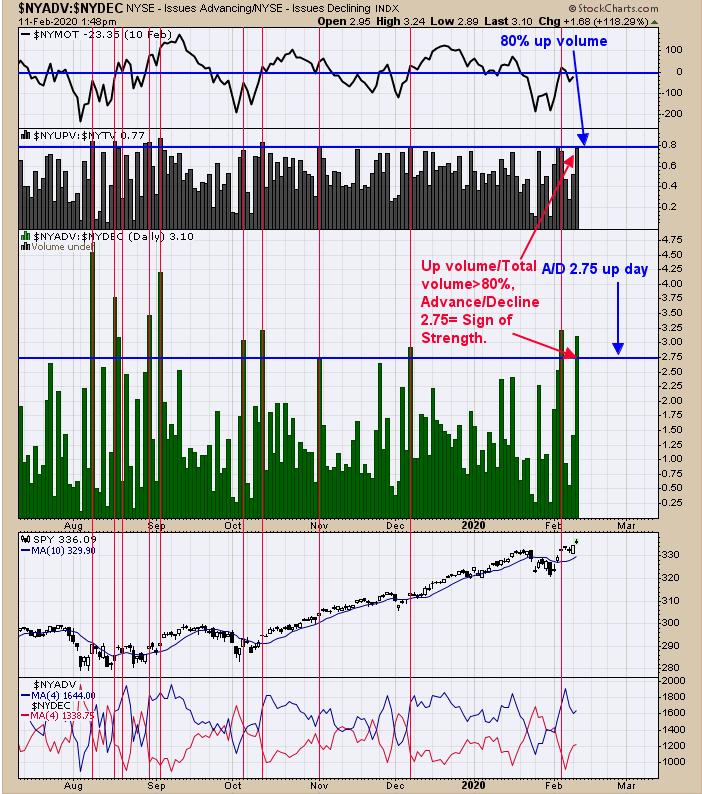
The above chart was taken a couple hours after the open. As you can see, the Up volume/Total volume was near 80% and showing a "Sign of Strength" (SOS). The Advance/Decline (middle window) showed a reading of 3.10, above 2.75, which is also an SOS. However, on the close, the Up Volume/Total Volume dropped to 70% and Advance/Decline ratio to 2.42 - both below an SOS. An SOS today would have been a very bullish sign for the short term. The trend is up but market still could stall short term. The red verticals on the chart were "SOS" days and there was one last week, which is a bullish sign.
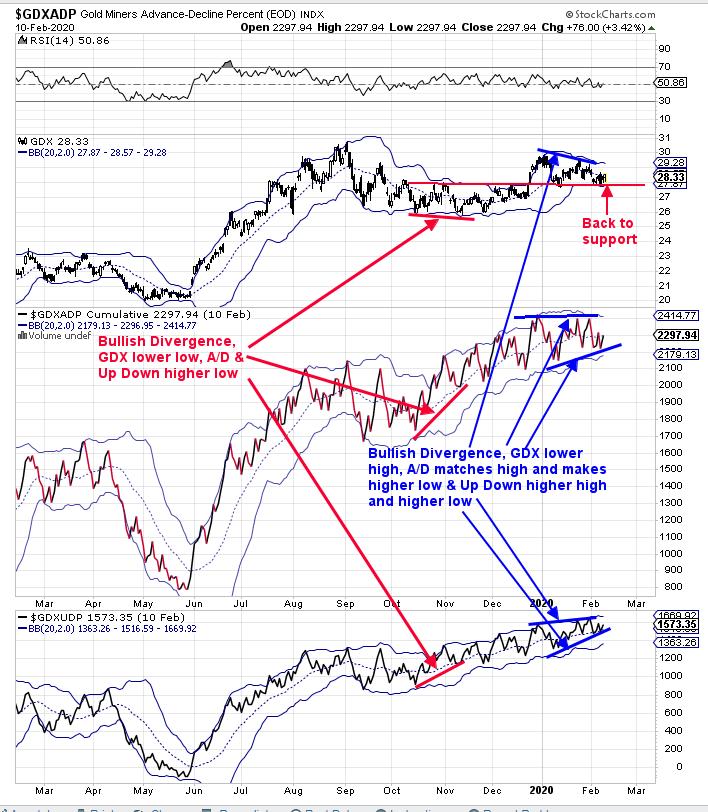
The internals so far look good for GDX. The bottom window is the Cumulative Up Down Volume percent for GDX. This indicator has been making higher lows and higher highs going back to late December, while GDX has made lower highs and matched its previous low, which is a bullish divergence. The next window up is the cumulative advance/decline percent, which has made higher lows and matched its previous high, which is also a bullish divergence. So far, these two indicators suggests there is strength in GDX, which would mean this sideways pattern should resort into a rally phase. GDX may see a "Sign of Strength" (strong high volume move) through the previous high of 31.00 in the coming weeks. Long GDX on 1/29/19 at 21.97.
Tim Ord,
Editor
www.ord-oracle.com. New Book release "The Secret Science of Price and Volume" by Timothy Ord, buy at www.Amazon.com.