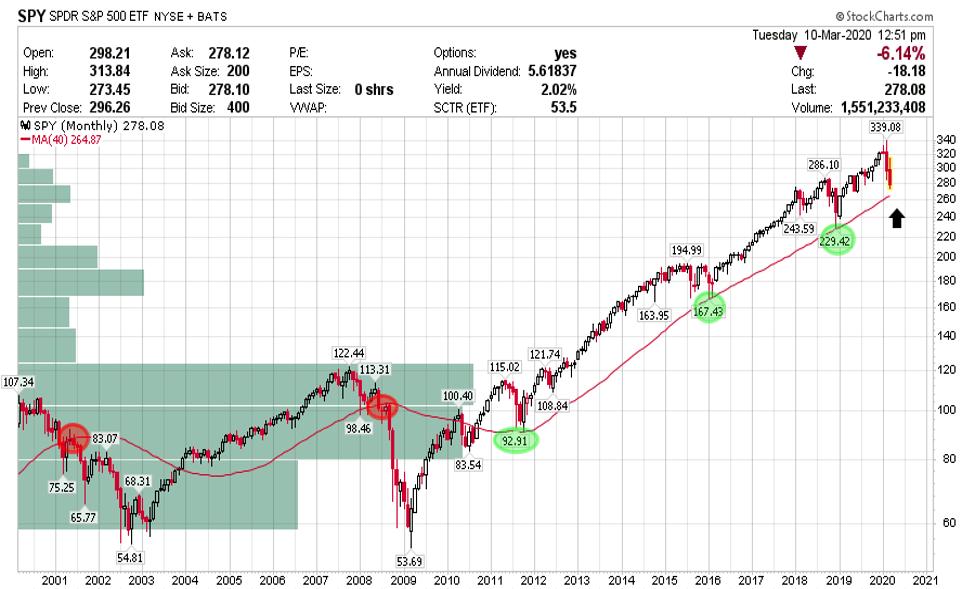
Hello fellow StockCharts users. As many of you know, there are a handful of intermarket charts and tools you can deploy to help you with uncertain times. I prefer this simple and easy chart of the SPY going back 20 years. This chart has helped me decide whether we are probably in a long-term uptrend or not on a longer-termed basis. The indicator that helped me assess whether we are possibly in an uptrend is the 40-month simple moving average, highlighted in red. This indicator is typically used to display the 200-day moving average on weekly charts. In this case, I decided to plot the 40-period moving average on the monthly chart. It has been pretty spot-on in determining where the SPY tends to bounce or fail. We can see the importance of the SPY holding or breaking this 40-month Moving Average in 2012, 2016 and 2018. Let's see whether it holds now in 2020. As of right now, we are still in an uptrend on the monthly chart. We haven't broken the 40-month moving average; if we break, like what happened in 2001 and 2008, it might increase the probability that we are officially in a downtrend on the monthly charts.
- Aleksandar Bozic