At the time of this writing, I am seeing many, many charts, including indexes, individual stocks and ETFs, that have formed sideways ranges and are in coiling type patterns.
I was a guest April 28, 2020 and May 7, 2020 on the new StockCharts.com show Your Daily Five, where technical analysts have 10 minutes to present 5 charts. My segment included a few coil patterns that are forming on many charts and my analysis is pointing towards a resolution coming soon.
These types of coils are found in classic technical analysis patterns, such as triangles, rectangles (which I nicknamed the "Money Box"), wedges, pennants and others.
The important concept to keep in mind with these types of patterns is that they are storing energy. The market is at an indecisive stage in a contraction phase. It may be that it is a pause in a trend or a reversal is at hand. Expansion phases follow contraction phases.
Whichever the case, these patterns are easily identifiable on charts and can be defined using trend lines. Most patterns of these types can utilize a measured move for estimating target areas. They also have clear areas of failure that can aid in stop-loss placement and potential areas to reverse a position.
Note: None of the markets, ETFs or stocks listed in this article are recommendations to buy or sell, this article is intended for educational purposes only.
The first chart is a daily chart of INTC, Intel Corp.
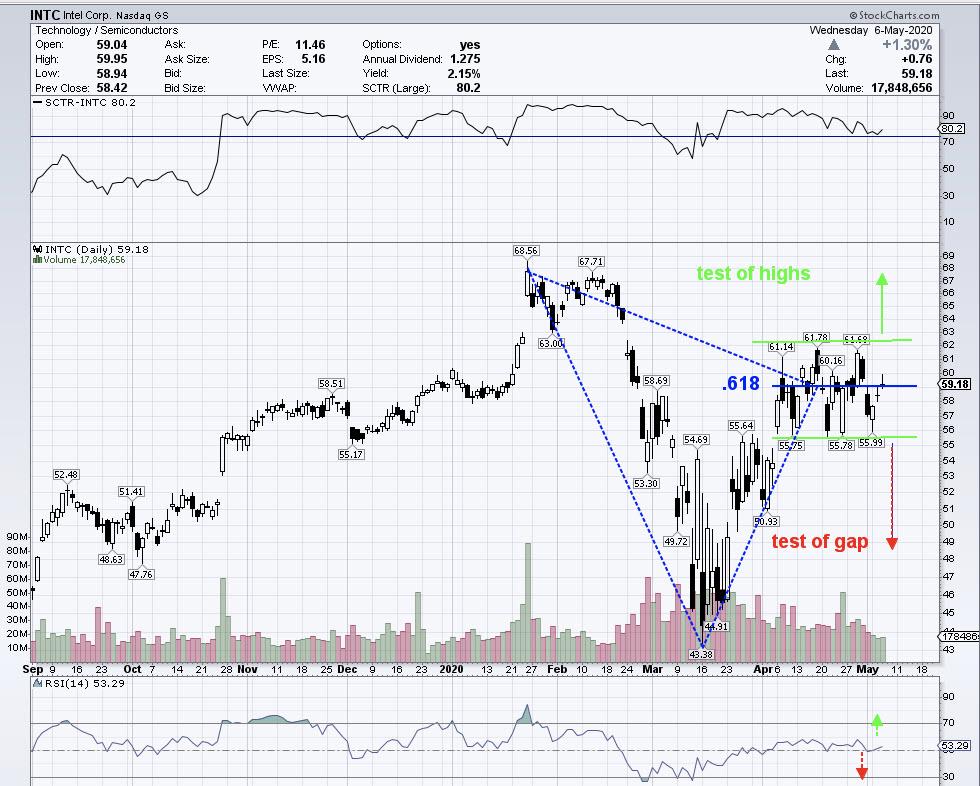 Chart 1 - INTC Rectangle (Money Box) Pattern
At the March 2020 lows, INTC showed early signs of strength, with strong bars to the upside from the lows, Inverse Head-and-Shoulder patterns, gaps to the upside and relative strength indicator bullish divergences that can be seen on this chart using the RSI below and the SCTR above (SCTR stands for StockCharts.com Technical Rank, which is a relative strength metric that rates the stock against peers). The RSI in the lower portion of the chart showed bullish divergences and strength in the rising RSI. The SCTR held the upper portion and higher levels of the readings during the decline, which is bullish.
INTC retraced the decline and is currently trading at and around the .618 retracement level. This is the center of the Money Box. When price creates a coil pattern, the tendencies are for swings in both directions that form the upper and lower trend line boundaries.
Eventually, price will find a center point or equilibrium point. This center point is important to monitor. It is a price area that will usually start to show more contraction in the later phase of the coil and, eventually, price will move away from the center point and out of the pattern in one direction or the other, the breakout point.
When monitoring coil patterns, you can assess fairly early that a coil is forming by recognizing the initial larger swings in both direction and observing price not continuing in either direction, sudden reversals without followthrough and an eventual "quieting" of price around a center point. This is the calm before the storm.
As you can see in Chart 1 of INTC, well-defined trend lines can be drawn on the upper and lower boundaries of the pattern.
Once the pattern is defined with trendlines, traders can determine potential targets using measured move projections and assess risk/reward.
To find the measured move projections, take the height of the pattern and project up from the highest point of the pattern for upside projections, project down for downside projections. Prices, once they demonstrate a breakout, will either:
- Successful breakout with followthrough, trending move. (There may be a retest, as shown in Chart 2 with MSFT.)
- Failed breakout attempt, price returns back into range (many times back towards center).
- Failed breakout on one end, reverses and successfully breaks out other end of range. These can be the strongest breakouts because they have fooled the most people.
- Failed breakout on one end, price then reverses and breaks out on opposite end, fails a second time and returns into range.
Because of the nature of the potential outcomes listed above, traders should have plans and risk assessments for all of the above.
As an example of the measured move targets for Chart 1 of INTC, here are the projections:
- Range is $6.20 (height)
- High price of range is $62.13
- Low price of range is $55.93
- Upside projection target; $62.13 + $6.20 = $68.33 (Note this is retest of February 2020 highs)
- Downside projection target; $55.93 - $6.20 = $49.73 (Note this is retest of gap area)
Also worth noting is that prices from breakout areas can go further than projections, or they can fail to reach the projection, so trade management should reflect these scenarios as well.
Traders that know Point & Figure charting would benefit from calculating projections using P&F charts with these types of patterns.
Let's look at Chart 2 featuring MSFT, which was in an extended coil for almost 14 years.
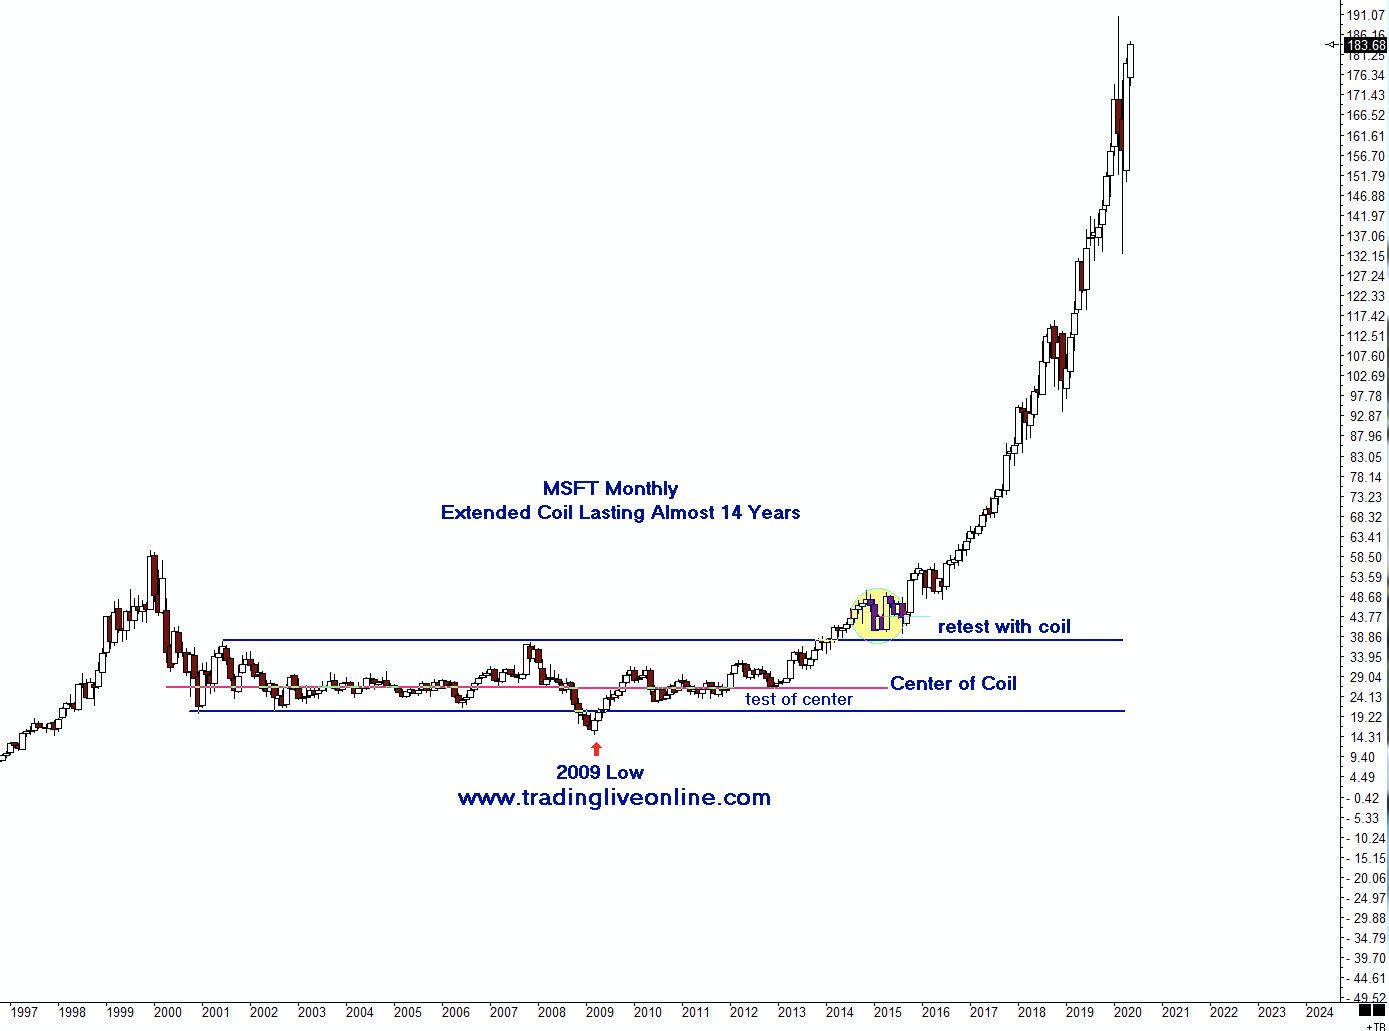 Chart 2 - MSFT Monthly Money Box Pattern
This is a monthly chart of MSFT showing an extremely long coil process. As you study the chart, note the "coils within coils." There were many smaller ranges visible on this monthly chart that did have breakouts, but price eventually returned to the center of the coil before finally having a powerful upside breakout in 2014. This is a beautiful example of contracting and expanding phases.
Notice the red line drawn through the center of the coil. The prices literally look like they are hanging and coiling around the center on this line. There are many moves away from the center price and followed by tests back to the center.
2009 saw prices have a failed downside breakout, only to then experience a resumption back into the range. This is an example of point #2 above.
The yellow circle illustrates point #1 above, where there is a breakout followed by a retest back to the breakout area. If you study this chart, you should be able to find all 4 points made above on the potential outcomes of this pattern.
Chart 3 is of JPM and a combination of Gartley Sell Patterns and a Triangle Pattern.
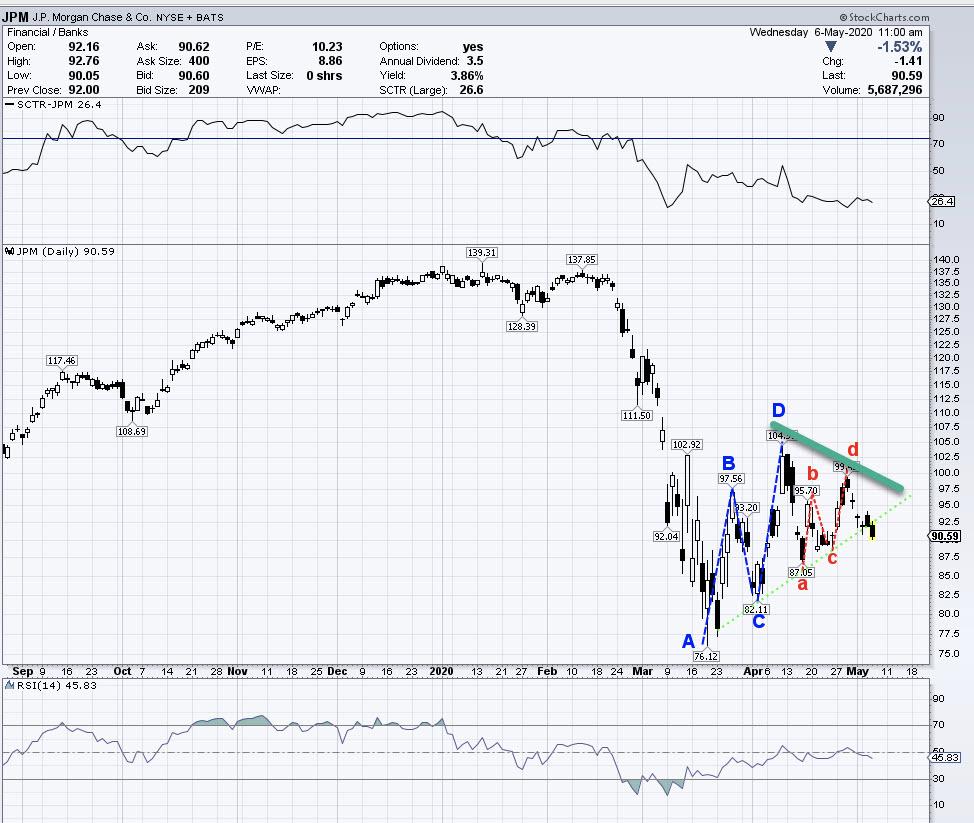 Chart 3 - JPM Daily AB=CD Gartley Sell Patterns with Triangle
The JPM chart is similar to many current charts in the financial sector. Many times in the formations of coil-type patterns, you will see and can trade the Gartley, Butterfly, 3 Drive and other Harmonic Patterns.
In this example, JPM formed a Gartley 222 retracement pattern (Blue) following the March 2020 lows. After a test down, another smaller retracement Gartley 222 pattern formed (Red).
These two patterns have now formed the upper boundary of a Triangle coil pattern. There is a slight break to the downside. Here, traders would monitor the price for continuation down. If there is a move up, but still below the upper trend line, then the lower trend line would be adjusted.
On this chart, we can look at the SCTR and RSI and see current weakness. However, if a potential upside break did occur, traders could monitor the strength utilizing both of these indicators.
In closing, I'd like to reiterate the simplistic nature of the coiling phase and the potential power of moves and trends that are born from these patterns. Within these patterns, while they are forming, there are trading setups, such as Gartley AB=CD buy and sell setups, Fibonacci extension patterns, Butterfly Patterns and 3 Drives Patterns. Please refer to my book Trade What You See: How to Profit From Pattern Recognition for more information.
It's always important to learn entry skills, which include combining elements of intraday time frames, momentum indicators and other price patterns to control risk and also, at times, waiting on the sideline until there is confirmation.
There are trading techniques that can be learned and implemented to control risk and monitor the price behavior. We never know what price will do; the only element we can control is the risk.
If you would like to learn more about these patterns and programs in order to learn how to trade them, please visit me at my website www.tradingliveonline.com or feel free to email me at ljouflas@msn.com.
Best wishes for successful trading!
Leslie Jouflas, CMT
See my appearances on Your Daily Five below:
April 28th, 2020:
May 7th, 2020: