In my April 9th article for StockCharts, entitled How Sustainable is this Rally?, I discussed our analytical/investment process at Asbury Research and said it was basically a two-step approach: #1: identifying the key price levels, and then #2: determining what to do at those levels. In that article, we pointed out that our Asbury 6 - one of two in-house models we use to make tactical trading decisions (Step #2) – had just turned back to a Positive/Risk On status on April 6th, after having been Negative/Risk Off since February 24th. Since April 6th, the benchmark S&P 500 (SPX) has risen by 296 points, or 11%, into the April 29th high.
That takes us to the present. Table 1 below shows that, through May 6th, four of the Asbury 6 are still showing a Positive (green) bias – the minimum number of constituents necessary for a positive signal. This means the "what to do" part of our process is still positive for stocks.
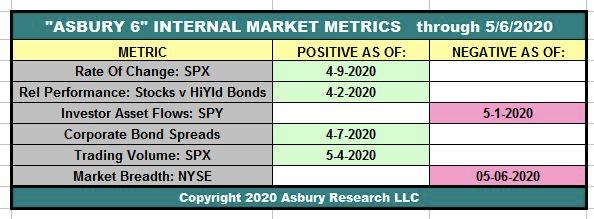 Table 1
Chart 1 below addresses Step #1 "identifying the key levels" part of the process, showing the S&P 500 is currently sandwiched between major overhead resistance at 2938 to 3002 and minor underlying support at 2731 to 2722. The 2938 to 3002 resistance area represents the 61.8% retracement of the entire February decline (pink highlights) and the 200-day moving average (orange highlights), the latter a widely watched major trend proxy. Below the market, the 2731 to 2722 area represents the 50-day moving average, a minor trend proxy (blue highlights), and the June and March 2019 benchmark lows (green highlights). Collectively, these levels define a relatively tight price window from which the US broad market's next one to several month directional move is likely to begin.
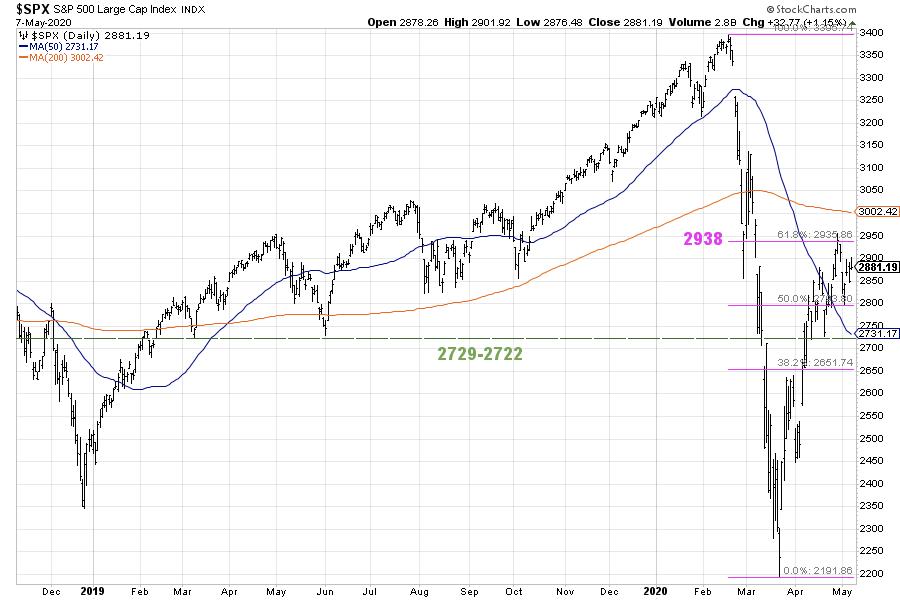 Chart 1
Now we go back to Step #2. As long as at least four of the A6 remain green/Positive, we will expect overhead resistance at 2938 to 3002 to eventually be broken. Should this occur, it would clear the way for even more strength. If four or more of the A6 turn red/Negative, however, confirmed by a decline back below 2731 to 2722 support , it will indicate the larger February decline is still intact and is resuming.
John Kosar, CMT
Chief Market Strategist, Asbury Research
You can sign up for Asbury Research's free bi-weekly Stock Market Update by clicking here.