
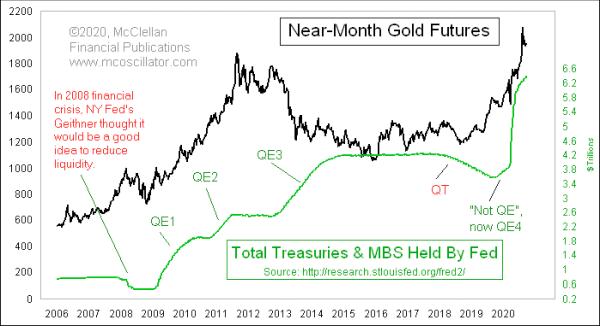
The total Fed holdings of Treasury debt and mortgage-backed securities (MBS) held by the Fed are now at $6.4 trillion, up by $68.8 billion this week for the weekly data reported on Sep. 16. All of that money-printing is adding to the total money supply and has assuredly helped to lift stock prices up out of the February to March 2020 COVID Crash.
A lot of analysts believe that all of this money-printing is bullish for gold prices. That belief system actually makes a lot of sense. After all, the amount of gold on planet earth is finite, and the price of anything is expressed as a ratio of money to stuff. So if the stuff remains constant and the money supply expands, it should reasonably mean that the money/stuff ratio expands, which is a fancy way of saying that the price should rise. But is that really what happens in real life?
I am reminded of Ronald Reagan's admonition that an economist is someone who sees something happen and wonders if it would work in theory. When it comes to gold and the money supply, a lot of analysts do not even bother looking at what happens; they have an elegant theory and that is enough for them.
We are currently in the Fed's fourth era of QE, known in shorthand as QE4. Looking at the prior episodes of QE, it is absolutely true that QE1 and QE2 coincided with big price rises for gold. And the pause periods in between those episodes saw gold also pause in its price rises. The end of QE2 in 2011 coincided approximately with the impressive peak that year in gold prices. So, based on just QE1 and QE2, one could make a strong argument that when the Fed is doing QE, it is bullish for gold prices.
That hypothesis runs into trouble when we expand our view. QE3 took place from 2012 to 2014, a period which saw gold prices trending downward. HUH?!! How can that be? How can money printing not be bullish for gold?
Looking further at the data, there was an episode of what we now refer to as "QT" or "quantitative tightening" back in 2008, when the Fed was reducing its holdings, yet gold prices managed to move up from around $700 to $1000. That behavior conflicts with the nice elegant hypothesis from QE1 and QE2 about how QE is bullish.
There was also an episode of QT from early 2018 through late 2019, when the Fed tried to reduce its holdings of Treasuries and MBS. That period initially saw gold prices go down, which is what should have happened. But as that QT episode continued, the elegant hypothesis again ran into trouble, as gold started to rally while the Fed was shrinking its holdings.
When the COVID Crash hit in early 2020, the Fed responded by pushing a bolus of liquidity into the banking system, through both conventional QE and by also increasing its holdings of "repurchase agreements" or repos. Gold traders responded as the hypothesis said should happen, pushing up gold prices to a new all-time spot gold price high of $2067 on Aug. 6, 2020.
But then, since that gold price top, something went horribly wrong with the hypothesis. The Fed has increased its Treasury and MBS holdings by another $173 billion since then, but gold has fallen by more than $100. What is the problem with gold?!! Doesn't it know how it is supposed to behave?
Perhaps our elegant hypothesis of QE being bullish for gold is not so elegant after all. It runs into more trouble when we look at actual money supply in the form of M2. In order to normalize the money supply data, I have divided M2 by GDP in this next chart. Additionally, I have shifted forward the M2/GDP ratio by 12 months. That lag offset works well for the stock market, but not so well for gold prices.
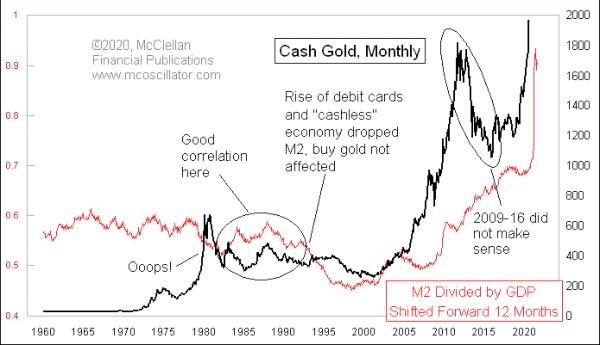
This is a great relationship, sometimes. Other times, not so much. It does not explain the great gold bubble of the late 1970s, when M2/GDP was actually falling. Gold also did not match the big drop in M2/GDP in the mid-1990s, when the move to debit cards enabled the money supply to drop without hurting gold prices.
The relationship of M2 and gold worked great from 2000-2009. But the M2 model said a dip should have happened in 2010-2011, and instead gold prices kept going higher. This model called for a big uptrend from 2011-2018, yet instead gold prices went thoroughly against that message.
Now with the Fed's helicopters dumping money on the banking system, we have seen a momentary return of the positive correlation. But is it an enduring resumption of the correlation which "should" work? Or is it only working lately as a self-fulfilling prophecy?
Therein lies our analytical problem. What should work in terms of the relationship between money supply and gold prices works often enough to convince everyone that the conventional hypothesis is correct. But it also fails often enough to convince those who will look that it is a problematic hypothesis. In other words, just because the Fed is continuing to inflate the money supply does not mean that gold has to respond as people think it should. Or maybe it is a good hypothesis, but gold has already over-responded in anticipation of all of that bullish bounty, and now that is being given back.
In other words, as Jim Dines famously said years ago, "Don't think... Look!" And, more important to remember: financial market relationships do not always have to follow even the most logical of hypotheses.