
SPX Monitoring Purposes: Long SPX on 9/10/20 at 3339.19
Monitoring Purposes GOLD: Long GDX on 7/8/20 at 38.62
Long Term SPX Monitor Purposes: Neutral
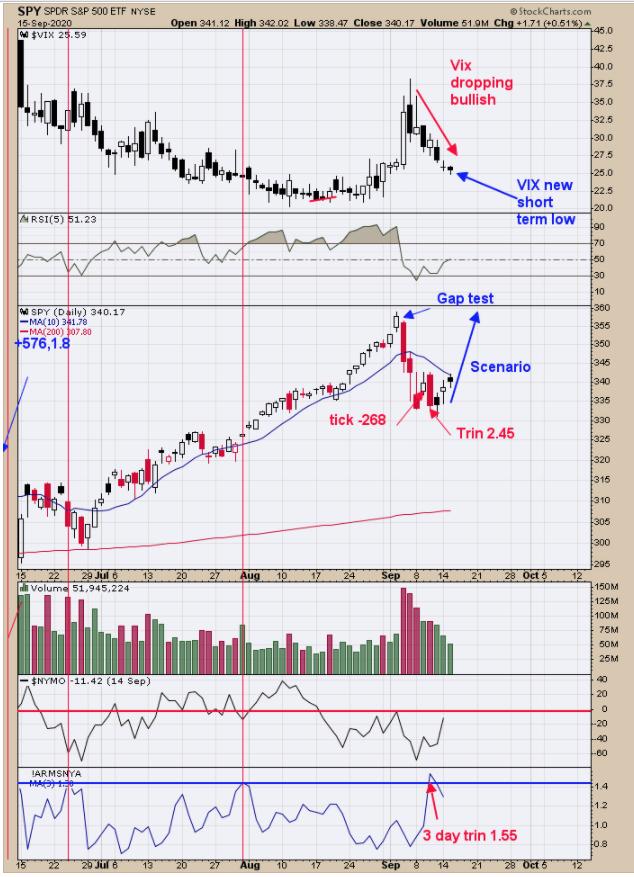
Yesterday we said, "Last Wednesday, the Tick closed at -268 and Thursday the TRIN closed at 2.45, both at bullish extremes and this combination have lead to short term lows. The 3-day TRIN reached 1.55 last Thursday and also at bullish levels. The top window is the VIX, which trades opposite the SPX and leads the SPX in the opposite direction. Today, the VIX closed at a new short-term low and suggests SPY should trade at a new short-term high soon. Possible upside target is the gap level near 355 SPY." Added to the above, today the VIX closed at a new short-term low again and keeps the short-term picture bullish.
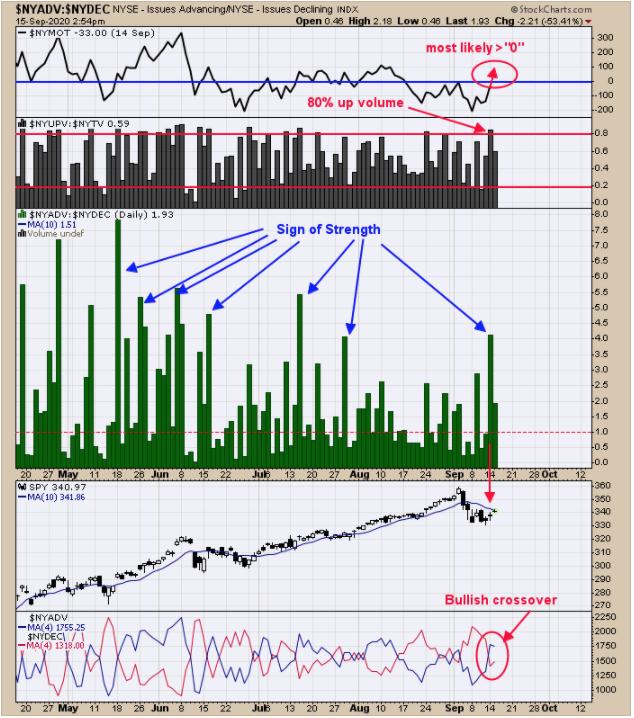
Yesterday's rally produced a "Sign of Strength". The middle window is the NYSE Advancing Issues to Declining Issues, which came in at 4.48. Yesterday, there were 4.48 stocks advancing to 1 stock declining, showing there where a lot of stocks carrying the rally. Next window up is the NYSE up volume to NYSE down volume, which came in at .80 yesterday, showing that 80% of the volume between up and down volume came on up volume and a show of strength. The bottom window is the NYSE advancing issues with 4-period moving average (blue line) and NYSE declining issues with 4-period moving average (red line); yesterday had a bullish crossover and remains bullish today. The top window is the McClellan Oscillator. Today's Advance/Decline showed about +400 to the upside and should push the McClellan Oscillator back above "0" and a bullish sign.
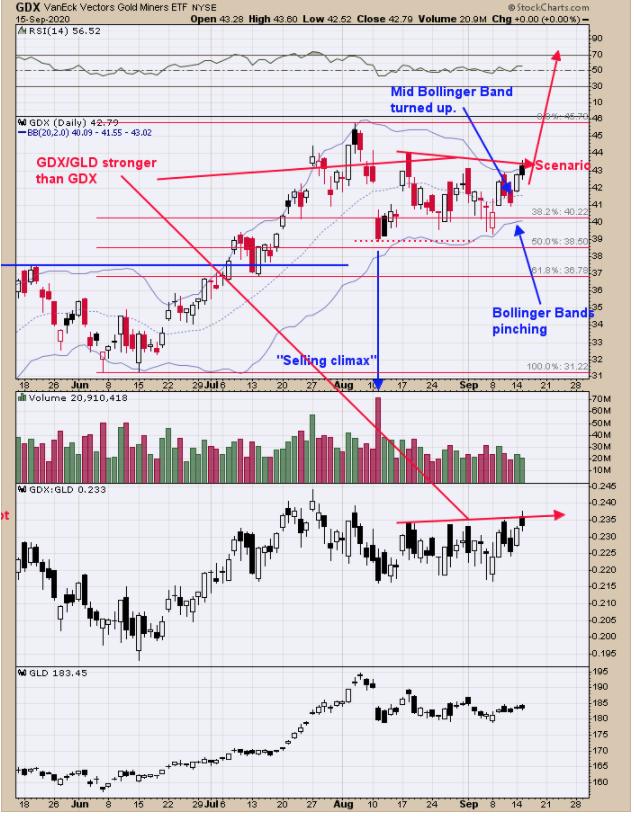
The chart is getting a little messy, but turn your attention to GDX/GLD ratio (second up from bottom) and GDX and compare the strength. GDX/GLD ratio made higher highs while GDX made lower high (red arrow). Normally, the GDX/GLD ratio leads the way for GDX; this is a short-term bullish sign. Yesterday, we said "GDX has been consolidating since early August and the Bollinger Bands are starting to pinch, suggesting an impulse wave is not far off. The middle Bollinger Band has turned up, which suggests the next move may be up. The consolidation from early August has retraced just less than 50% from the June low. This suggests the consolidation may be at the halfway point of the move up, which would give a target near 54.00 range on GDX. Silver stocks should outperform gold stocks on the next potential impulse rally. The next impulse wave high may end the rally phase that began at the March low. So the next high could lead to a multi-month consolidation that could extend into next year." Long GDX on 7/8/20 at 38.62.
Tim Ord,
Editor
www.ord-oracle.com. New Book release "The Secret Science of Price and Volume" by Timothy Ord, buy at www.Amazon.com.