
SPX Monitoring Purposes: Sold long SPX on 12/21/20 at 3694.90 = gain 1.3%; long 12/14/20 at 3647.49.
Monitoring Purposes GOLD: Long GDX on 10/9/20 at 40.78.
Long Term SPX Monitor Purposes: Long SPX on 10/26/20 at 3400.97.
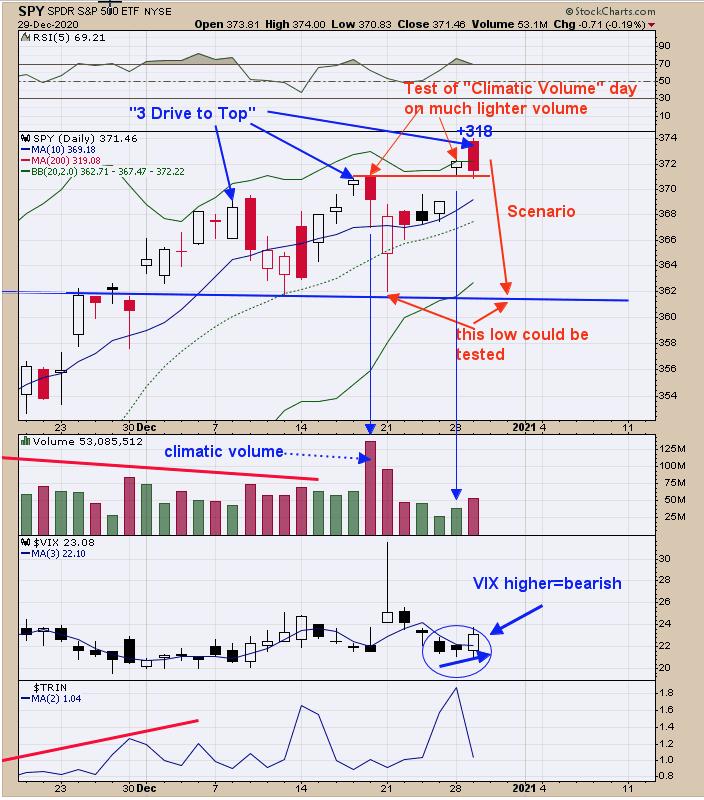
The pattern forming on SPY appears to be "Three Drives to Top". This pattern has a downside target to where the pattern began, which is near 362. Yesterday's break to new highs came on much lighter volume, suggesting a false breakout. Today, the market gapped up and closed lower, producing a candlestick pattern called a "Bearish Engulfing" and another bearish sign. Today's TICK also closed at +318, suggesting short-term exhaustion. Yesterday's 2-day TRIN closed >3.00, which leans bullish. The VIX closed higher today and another bearish sign. Tops can hold up a while before the pullback begins (unlike bottoms that end in a flash) so we are taking our time. Today's close did not close below the previous high, so there is a possibility this top could linger a while longer. Will remain neutral short-term and bullish intermediate-term for the SPX.
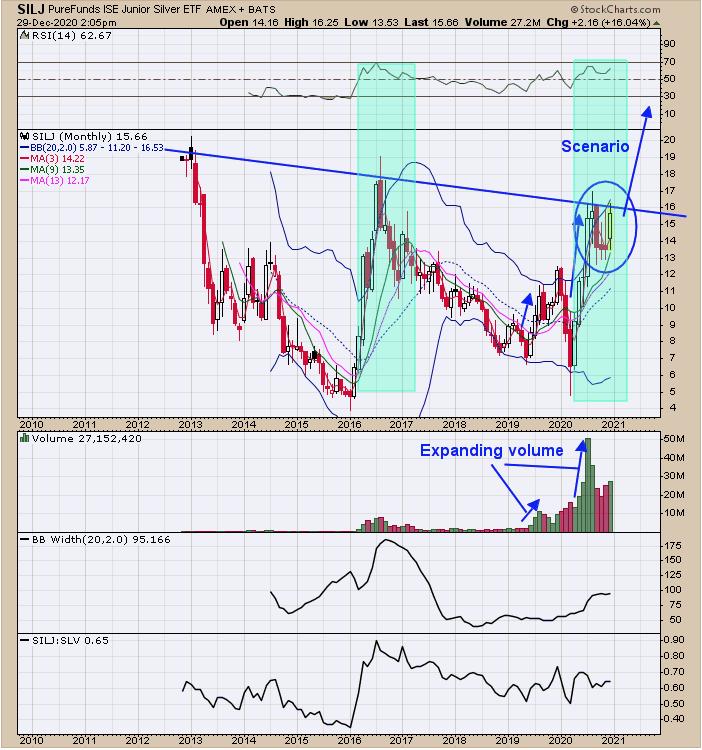
Above is the monthly junior stock silver ETF fund (SILJ) going back to late 2012. It is common for markets to breakout on the third attempt of a trend line, and it's a bullish sign when the market stays near the breakout area. SILJ is testing the trend line dating back to 2013 for a third time and has stayed near this trend line since August, suggesting the breakout is very near. It's also a bullish sign when volume expands as the trend line is approached (which is happening here). If this breakout does occur (most likely will within a few weeks or sooner), it will have a measured target from the distance below the trend line added to the break above the trend line. In this case, one can add around 10 points, giving a target near 26.00. We pointed out in the past that silver stocks should outperform gold stocks, and this chart helps to support that.
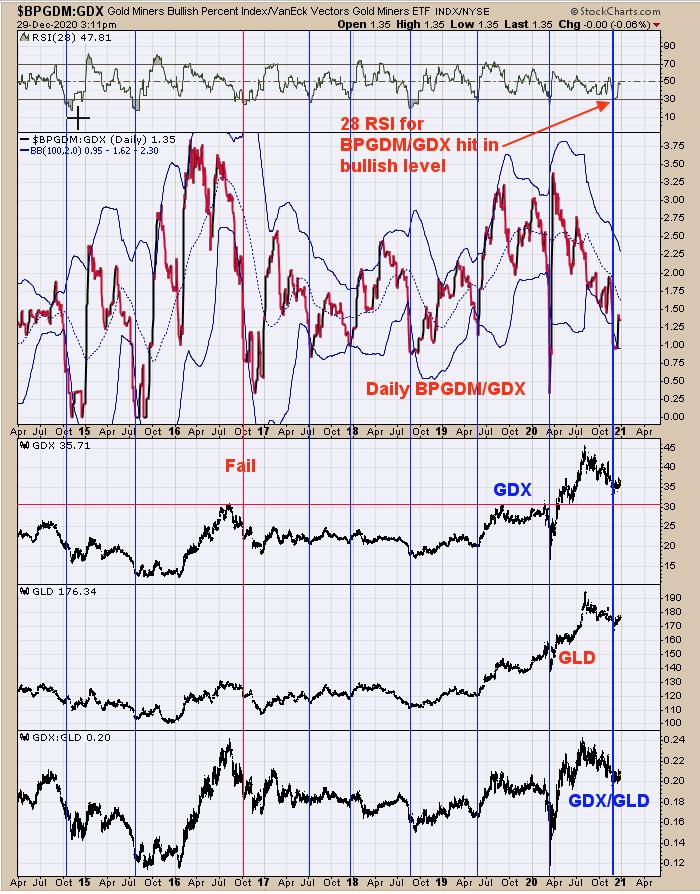
The second window down from the top is the daily Bullish Percent index for the Gold miner's index/GDX ratio. The top window is the RSI for this ratio. The chart goes back to early 2014. Bullish signals are triggered when the RSI of this ratio falls below 30; these are identified with blue vertical lines (one failed marked with red line). It is taking its time, but it does appear GDX is turning up. We have several silver stocks that have already broken out, suggesting gold stocks should follow soon. Long GDX on 10/9/20 at 40.78.
Tim Ord,
Editor
www.ord-oracle.com. New Book release "The Secret Science of Price and Volume" by Timothy Ord, buy at www.Amazon.com.