
SPX Monitoring Purposes: Long SPX on 3/12/21 at 3943.32
Monitoring Purposes GOLD: Long GDX on 10/9/20 at 40.78.
Long Term SPX Monitor Purposes: Sold long SPX on 1/15/21 at 3768.25= gain 10.80%; Long SPX on 10/26/20 at 3400.97.
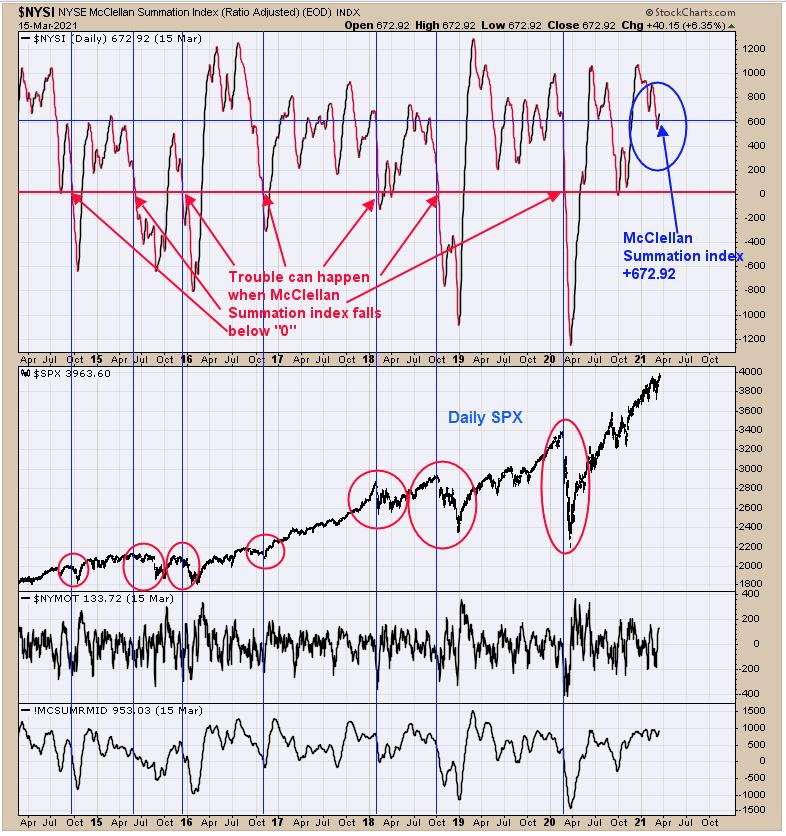
Above is a chart helps to show the health of the market. The top window is the McClellan Summation index. A McClellan Summation index above "0" implies the market is in bull mode; readings above +600 implies the market is in a strong bull mode. The current reading stands at +672.92 and rising. Large market declines usually occur when the McClellan Summation index falls below "0" (pointed out with red arrows). There can be short term pull backs, but the intermediate-term trend remains strongly up.
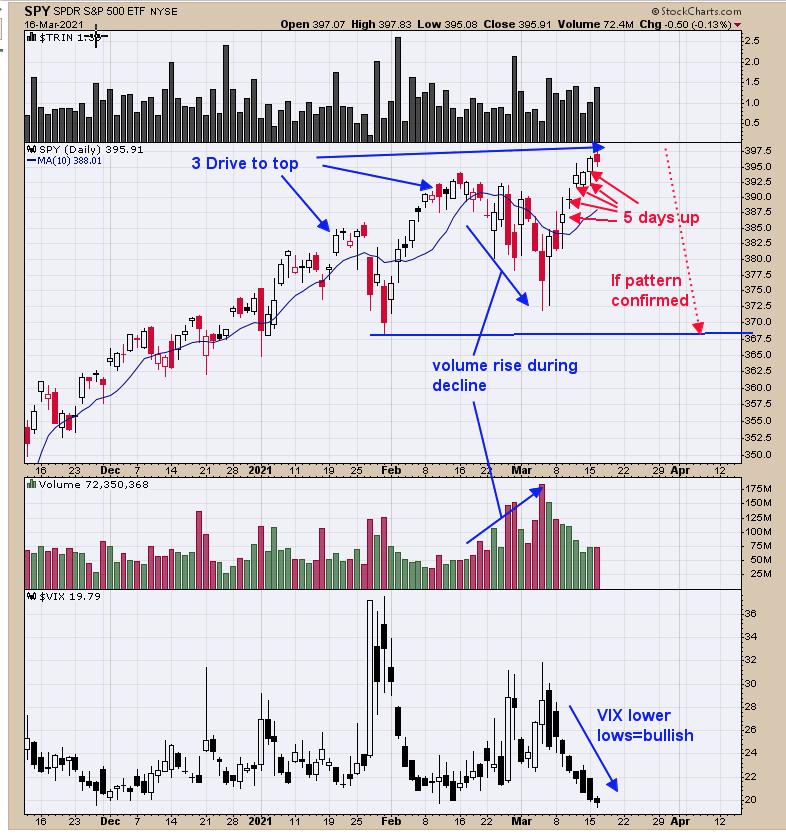
Yesterday marks five days up in a row for the SPY; five days higher in a row predict market will be higher within five days 88% of the time. Today, the VIX moved to a new short term low, confirming the new short term high on the SPY. May see 4000 on the SPX where volatility may pick up, as round numbers seem to do that. A potential pattern that may be developing over the last several weeks is a pattern called "Three Drives to Top." This pattern makes three higher highs, where the second high retraces at least 68.2% of the previous rally and volume increases on that pullback. This setup matches the current SPY trading pattern. The Three Drives to Top has a downside target to where the pattern began which near the 370 SPY range. The short term trend remains bullish for now, but I'm keeping an eye on the potential development of this pattern. We should see additional signs in the coming days to confirm or deny this pattern.
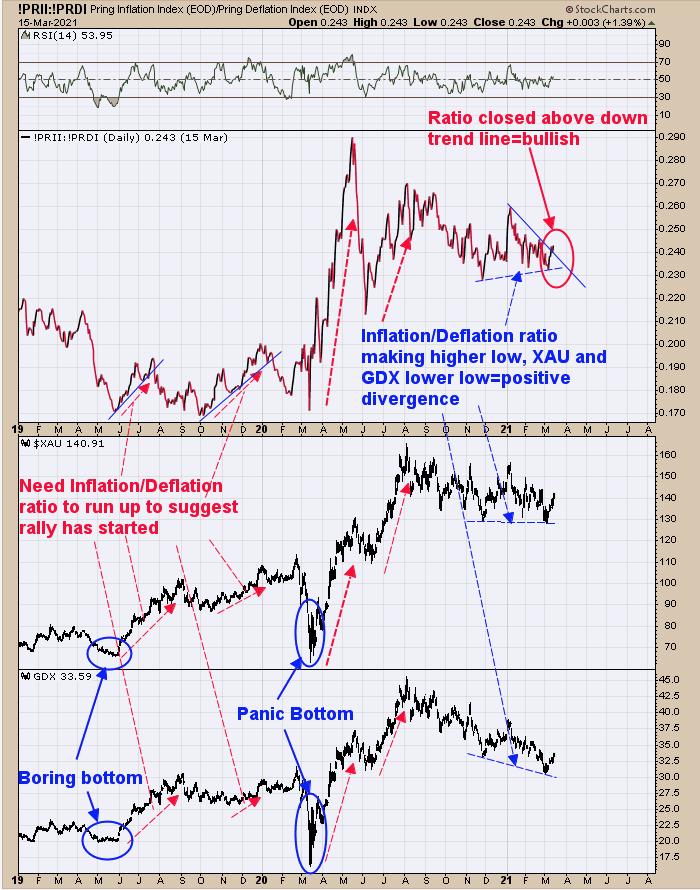
We updated this chart from yesterday, noting, "[the] second window down from the top is the Inflation/Deflation ratio. It is bullish for GDX (XAU) when this ratio is rising. Since November, this ratio has made a higher low where GDX (XAU) has made a lower low, which is a bullish divergence. This ratio is now testing the downtrend line connecting the highs going back to the January high. It's at the downtrend line now; a close above this line will suggest the low is in for GDX (XAU) as this ratio leads. The low in GDX could be in, but it too soon to tell for sure." Today the ratio closed above its downtrend line and adds to the bullish short-term picture. Long GDX (10/9/20 at 40.78).
Tim Ord,
Editor
www.ord-oracle.com. New Book release "The Secret Science of Price and Volume" by Timothy Ord, buy at www.Amazon.com.