
SPX Monitoring Purposes: Long SPX 6/28/21 at 4290.61.
Monitoring Purposes GOLD: Long GDX on 10/9/20 at 40.78.
Long Term SPX Monitor Purposes: Neutral
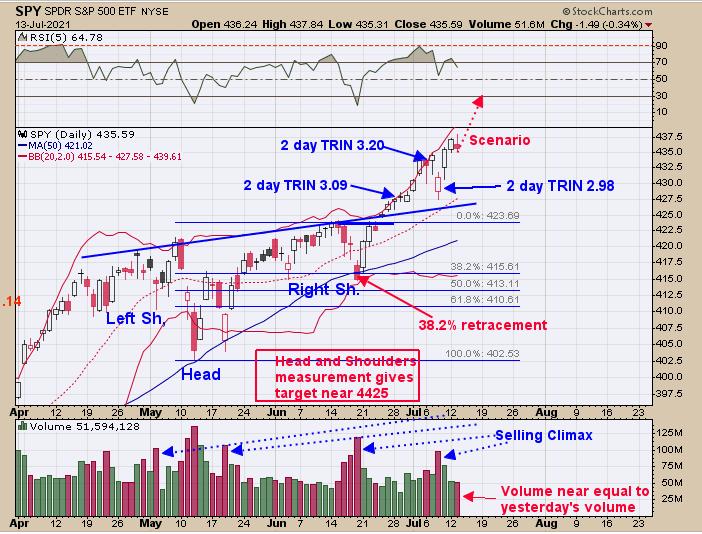
Yesterday, we said "The pattern that appears to be forming is a head-and-shoulders bottom, where the double Head came at the mid-May lows. This potential head-and-shoulders bottom has a measured target near 4425 on the SPX. Last Thursday, the two day TRIN added up to 2.98; readings near 3.00 and higher is a bullish sign short term. Last Tuesday, the 2-day TRIN came in at 3.20 and adds to the bullish sign. Last Thursday's decline marked a "selling climax" which suggests downside exhaustion. . . . . . . the head-and-shoulders measured target near 4425 seems a reasonable target short term." Added to the above, today's intraday rally touched a new high and volume was near equal to yesterday's volume and suggests the market has energy to push higher. If volume was 10% less than yesterday's volume, then the market could stall here.
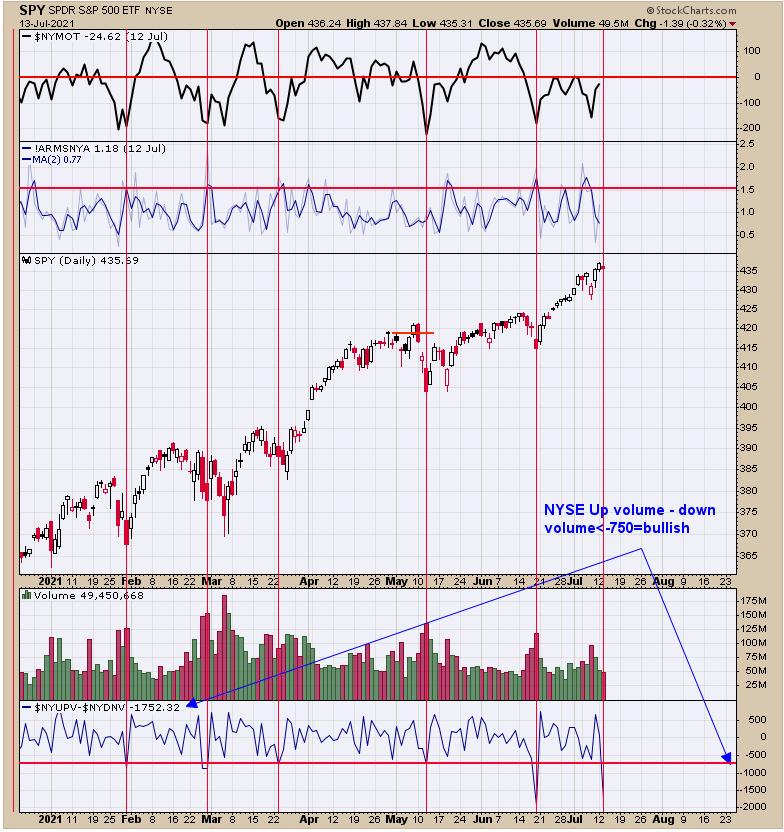
Everyone is heading to the exit the same time. Today's modest decline in the SPX produced NYSE up volume minus NYSE down volume of -1752. The bottom window is the UP volume minus down volume indicator, and when this indicator reaches -750 and lower, the market is near a short-term low. When few are expecting a pullback is when a worthwhile pullback does materialize. This week is also options expiration week, which usually has a bullish bias.
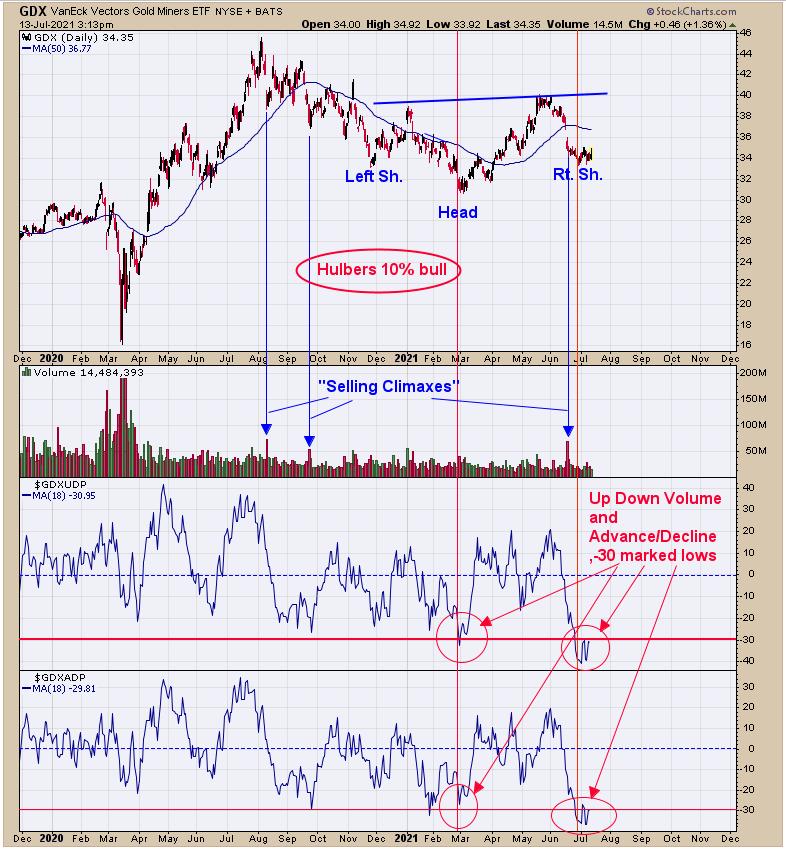
We updated this chart from yesterday, when we had said "The bottom two windows are the indicators we have been pointing out in our reports, which are the 18-day average of the Advance/Decline Percent and Up Down Volume percent and both are below -30 and in the buy area. Previous times when both indicators reached below -30, GDX were at least in a basing area and, at best, started the rally phase. We marked on the chart above where selling climaxes have occurred over the last year. A 'Selling Climax' occurs when Volume jumps near 50% compared to the previous day's volume and shows exhaustion to the downside. The last selling climax came June 17 and, since then, GDX has moved sideways. Sentiment also plays an important element on market reversals. The last update from Hulbert Financial sentiment reading for gold came in at 10% bulls, which suggests the market is at or very close to a low or has made a low. Most indicators are set for a rally to begin. The pattern that appears to be forming is a head-and-shoulders bottom where the Head is the March low." Nothing new to add. It does appear a base has formed and a rally is forthcoming.
Tim Ord,
Editor
www.ord-oracle.com. New Book release "The Secret Science of Price and Volume" by Timothy Ord, buy at www.Amazon.com.