
SPX Monitoring Purposes: Sold 10/18/21 at 4480.66= gain 2.68%; Long SPX on 10/13/21 at 4363.80.
Monitoring Purposes GOLD: Long GDX on 10/9/20 at 40.78.
Long Term SPX Monitor Purposes: Neutral.
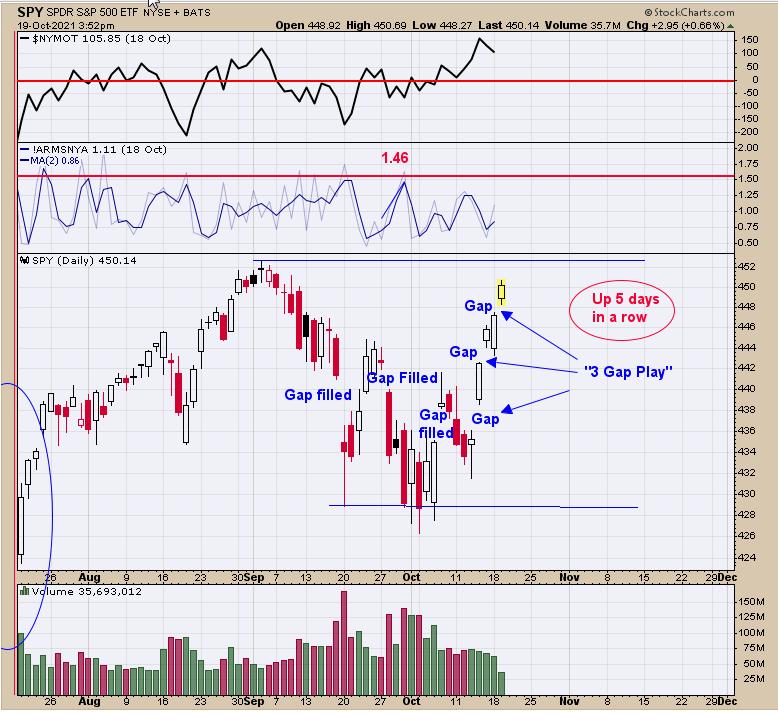
Above is the daily SPY chart showing all the gaps going back to 9/20/21. Today marks five days up in a row on the SPY. History shows that, when the SPX is up five days in a row, the market will be higher within five days 84% of the time, so moment is up but extended short term. Today's also marks a third gap up within the last four trading days. In Japanese candlestick charts, they call this a "Three Gap Play", which suggests the market can pull back to first gap before reversing higher again. Both 5 days up and three gap plays are short-term bearish but intermediate-term bullish. SPY is only a short distance away from the September high and may touch that level before a pull back begins. Intermediate term remains bullish but could see short-term pull back before week is out. Sold long SPX on 20/18/21 close for a gain of 2.68%.
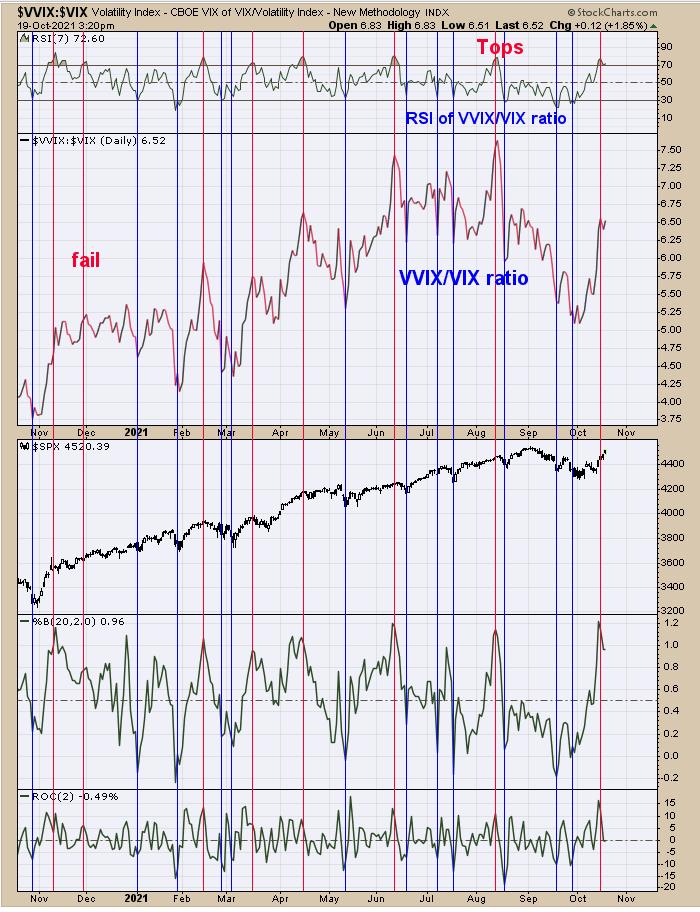
We updated this chart from yesterday, when we said "Here is an indicator that can warn that the short-term high may not be far off. The second window down from the top is the VVIX/VIX ratio and its RSI in the top window. When the RSI for the VVIX/VIX ratio reaches above 70, the market can be near a stall area, if not a short-term high. The chart above goes back one year and the red vertical lines show when the RSI reached +70 which were 8 times. Of the eight times the RSI reached +70, the market at least stalled seven of those times, which works out 87.5% of the time." The SPX did push higher for the five days in a row; it's rare for the market to be up six days in a row. It would seem a short-term consolidation is due as the RSI is still greater than 70 on the VVIX/VIX ratio.
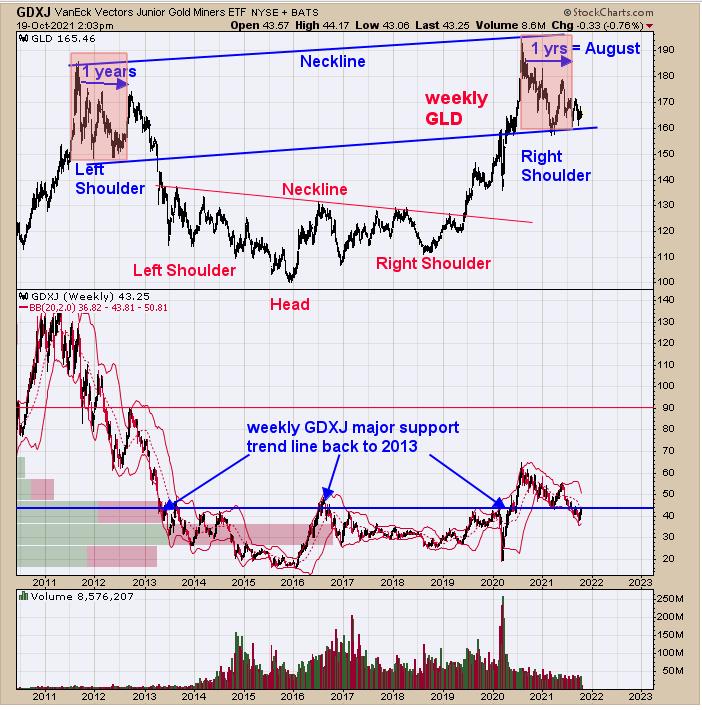
The top window is the weekly GLD (ETF for Gold) going back to mid-2010. The low in 2016 marked the head of a smaller Head-and-shoulders bottom, the neckline of which was broken in mid-2019 and rallied to a high in August of 2020. Since August of 2020, GLD looks to be forming a "Right Shoulder" of a bigger head-and-shoulders bottom (noted in blue lettering). Its common for the "Left Shoulder" to rhyme with the right shoulder in time and price and it looks as though it about time for the right shoulder to start moving higher to match the rhyme with the left. The neckline of the large head-and-shoulders bottom comes in near 200, which is where a "Sign of Strength" should develop, as that is what is needed to break the neckline. This potential head-and-shoulders bottom pattern has an upside target to 400 (distance from Head to Neckline and add that to the Neckline which equal near 400). It would appear the waiting for this large pattern to play out will be worth the time.
Tim Ord,
Editor
www.ord-oracle.com. New Book release "The Secret Science of Price and Volume" by Timothy Ord, buy at www.Amazon.com.