
SPX Monitoring Purposes: Sold long 12/21/21 at 4649.23=gain 1.8%; long SPX 11/30/21 at 4566.97.
Monitoring purposes GOLD: Long GDX on 10/9/20 at 40.78.
Long Term SPX Monitor Purposes: Neutral
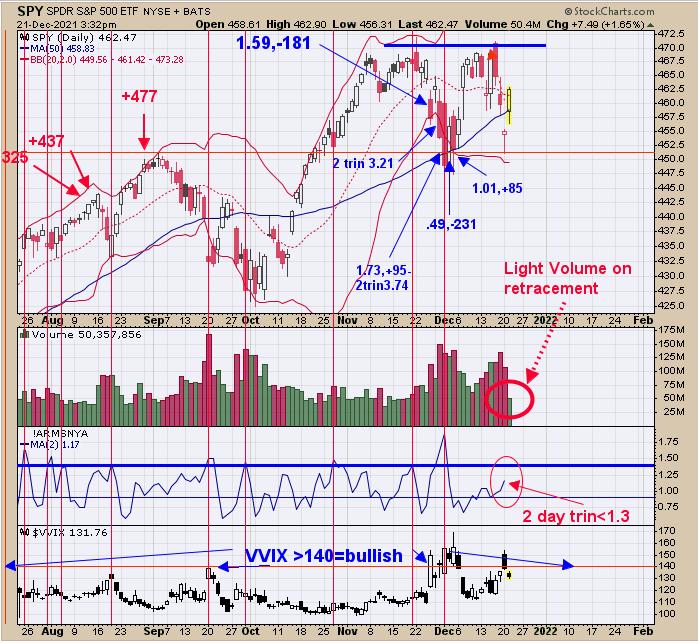
The chart is a little messy, but this is what I watch throughout the day. The bottom window is the VVIX and a reading above +140 shows panic, suggesting a bottom is near for the market (it did reach above +140 yesterday). The next window up is the 2-day TRIN. Readings above 1.30 suggests panic; yesterday, it reached 1.17, not confirming a low. The red vertical lines show times in the past when the 2-day trin reached above 1.30. Today's volume was very light and not showing a lot of energy on the rally (this could be due to the approaching Christmas holiday). The intermediate term looks OK as the sentiment readings on page two suggests a bullish lean. We sold our position today for a gain of 1.80%.
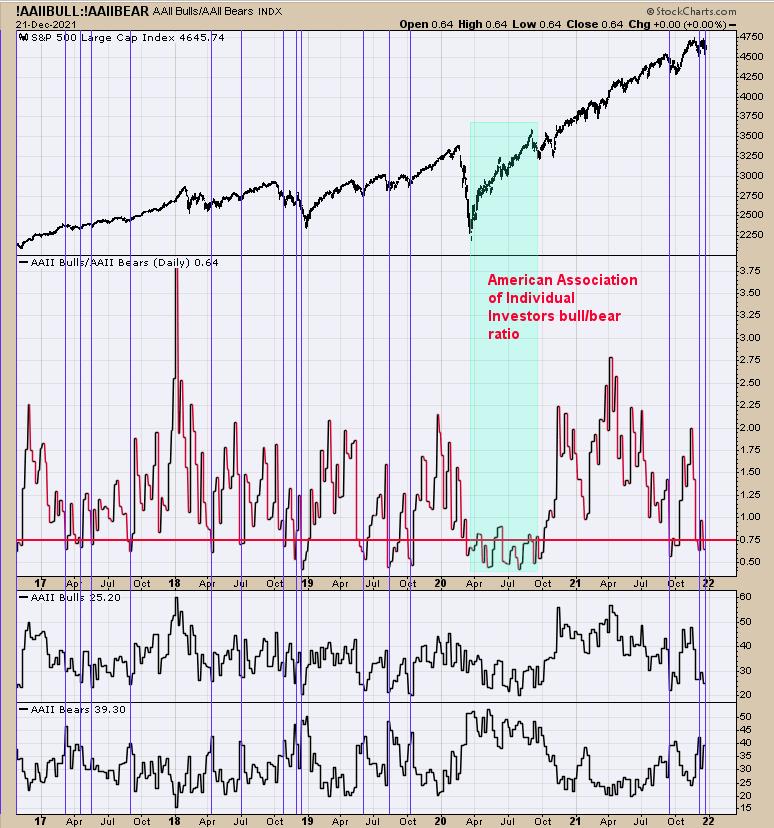
We updated this chart from yesterday. "Last Thursday," we said yesterday, "we showed the National Association of Active Investment Managers (NAAIM) chart. This sentiment indicator shows what exposure in the market the money managers have. It has been a bullish sign for the market when NAAIM falls to touch its lower Bollinger Band (which is a reading of 0 or less). A reading of "0" was recorded last Wednesday. Above is the American Association of Individual Investors bull/bear ratio, which is another sentiment indicator. It has been a bullish sign for the market when this sentiment ratio falls below .75 (current reading is .64). We have two different groups of investors (investment managers and individual investors) leaning heavily on the bearish scale going into the bullish seasonality period. The odds suggest a break above the 470 SPY before the month is out. If that does not happen, then a different scenario may be unfolding; we will cover that if 470 SPY is not exceeded." What is gives us pause here is that the TICK and TRIN yesterday did not reach panic levels -- panic are what bottoms are made of. In rallies where TICK and TRIN readings were not at panic levels, the rally sometimes failed.
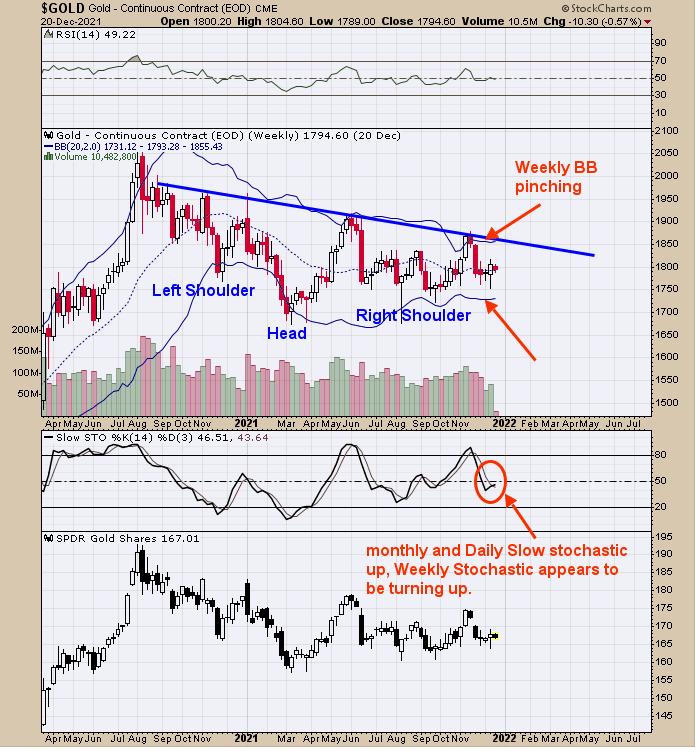
Yesterday, we presented the monthly Gold chart and showed the Slow stochastic has turned up. On previous reports, we showed the daily Gold chart and pointed out that the daily slow stochastic has turned up. Above is the weekly Gold chart (which is the right shoulders of the monthly gold chart) and the pattern forming appears to be a head-and-shoulders bottom pattern. The week is not out, but if Gold holds here or moves higher before the week is out, it will keep the slow stochastic in an uptrend. If that happens, than the monthly, weekly and daily Stochastic will all be in an uptrend. The monthly charts rule the weekly charts and the weekly rule the daily charts. Our opinion is that the monthly Gold will break its downtrend line (near 1825) this month and the long-awaited rally will start.
Tim Ord,
Editor
www.ord-oracle.com. New Book release "The Secret Science of Price and Volume" by Timothy Ord, buy at www.Amazon.com.