
SPX Monitoring Purposes: Sold long 12/21/21 at 4649.23=gain 1.8%; long SPX 11/30/21 at 4566.97.
Monitoring Purposes GOLD: Long GDX on 10/9/20 at 40.78.
Long Term SPX Monitor Purposes: Neutral
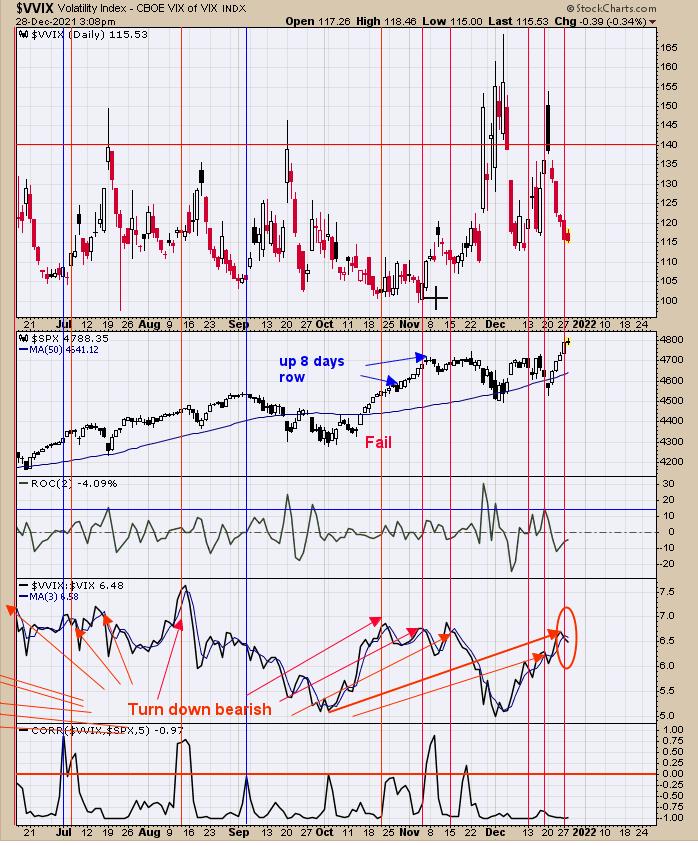
The second window up from the bottom is the VVIX/VIX ratio. When this ratio falls below its 3-day average, it warns of the potential for a short-term pullback and today it produced a bearish crossover. The SPX nor the SPY made it to 5 days up today, but the SPX futures did, which could maintain the possibility that the market may be higher within five days 83% of the time. Seasonality-wise, this coming Friday is higher only 33% of the time and could be the low day if panic in the TICK and TRIN is produced. Support now lies near the 4700 range on the SPX. We sold our position for a gain of 1.80%.
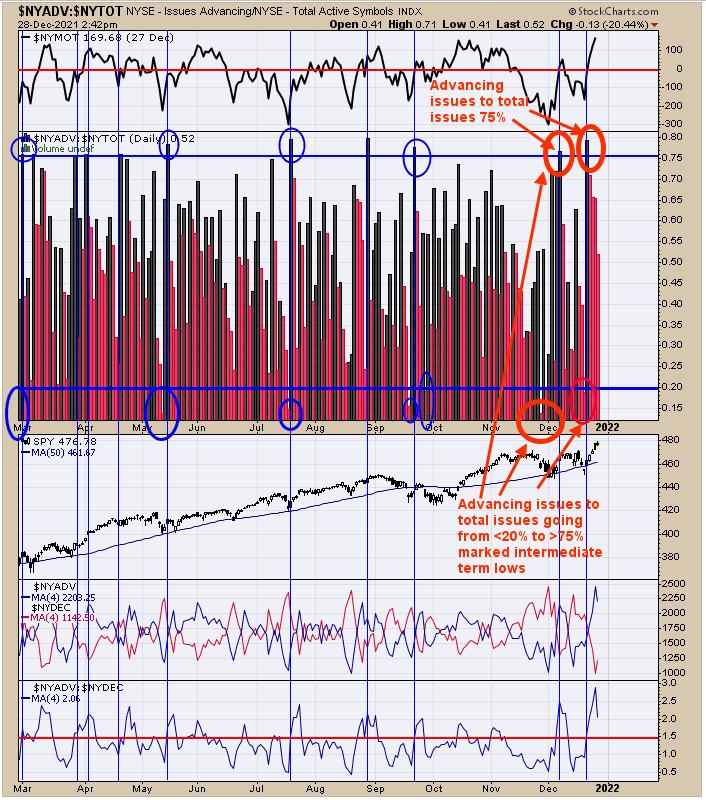
Though the McClellan Summation index is still below "0", which suggests weakness, there are indicators that are showing strong underlying strength. Above is the NYSE Advancing Issues/NYSE Total Issues ratio. Intermediate-term lows have formed when this ratio reaches below 20% (showing exhaustion), then immediately reaches +75% (showing initiation). This condition happen twice since the early December low (see chart above). Previous times this has happened are marked with a blue vertical line. There is underlining strength in the market, which should help push the McClellan Summation index back above 0 in the coming days.
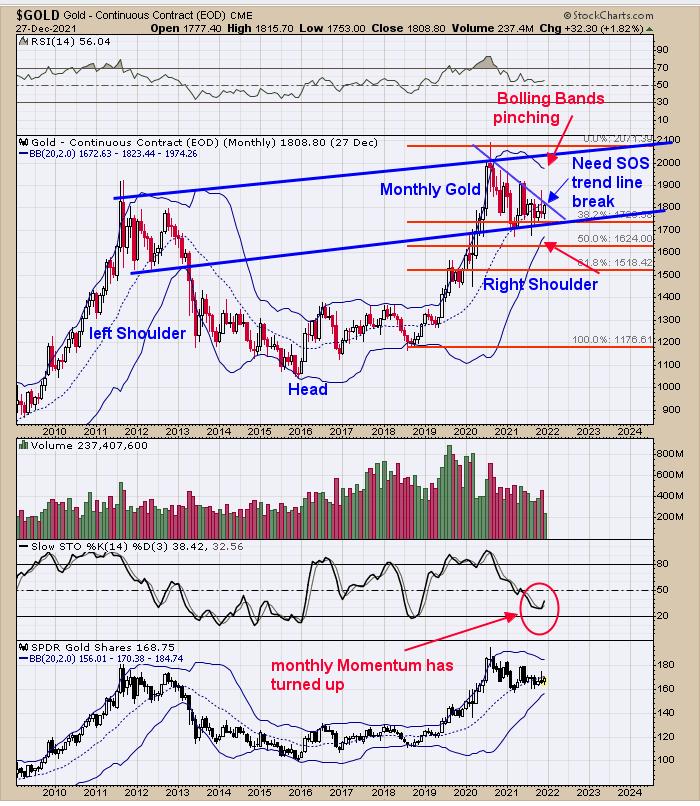
Above is the monthly Gold chart going back to 2010. Momentum rules all indicators and the Slow stochastic for Gold has turned up on the monthly (second window up) along with the weekly and daily. The start of an uptrend on Gold has started. We have drawn a trend line down from the 8/2020 high and the trend line break comes in near 1825 range on gold, which we are very close to breaking. We should see a "Sign of Strength" (SOS) through this trend line, which will add more confirmation that the rally in gold has started. Notice also that the Bollinger bands are starting to pinch, suggesting the trading range that started back in 8/2020 is near an end and an impulse wave is about to start. Sometimes on the beginning of these big moves a "shakeout" is performed before the move actually begins, which could happen here. Shakeout or no shakeout, the rally in Gold appears to have started.
Tim Ord,
Editor
www.ord-oracle.com. New Book release "The Secret Science of Price and Volume" by Timothy Ord, buy at www.Amazon.com.