
SPX Monitoring Purposes: Long SPX 11/30/21 at 4566.97.
Monitoring Purposes GOLD: Long GDX on 10/9/20 at 40.78.
Long Term SPX Monitor Purposes: Neutral
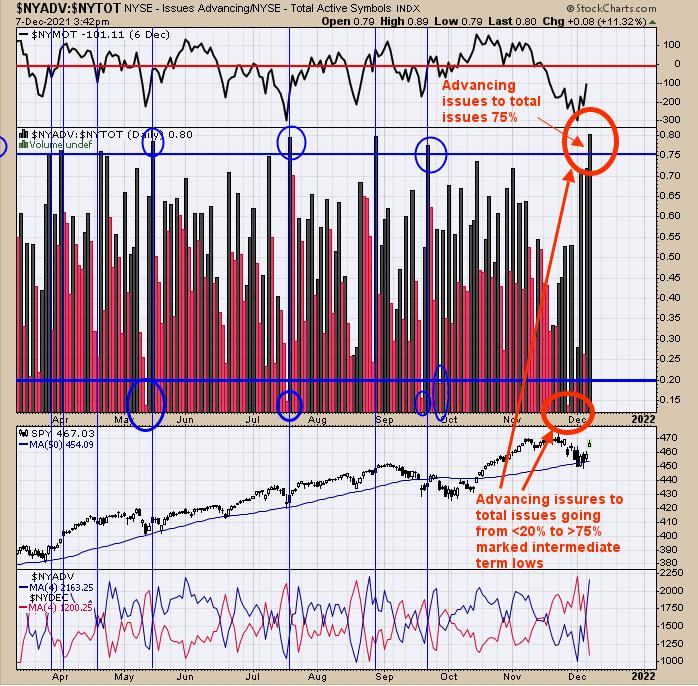
We had a similar chart yesterday, but it was on the SPX. The one above is the NYSE Advancing Issues/Total Issues. When NYSE Advancing Issues/Total Issues falls below .20 (November 28 was .14), then rallies to +75 (current reading is .80) in a short timespan, it's an intermediate-term bullish sign. The blue circles on the chart above are the previous times this has happened and all went on to make new highs in the SPY. We are long SPX on 11/30/21 at 4566.97.
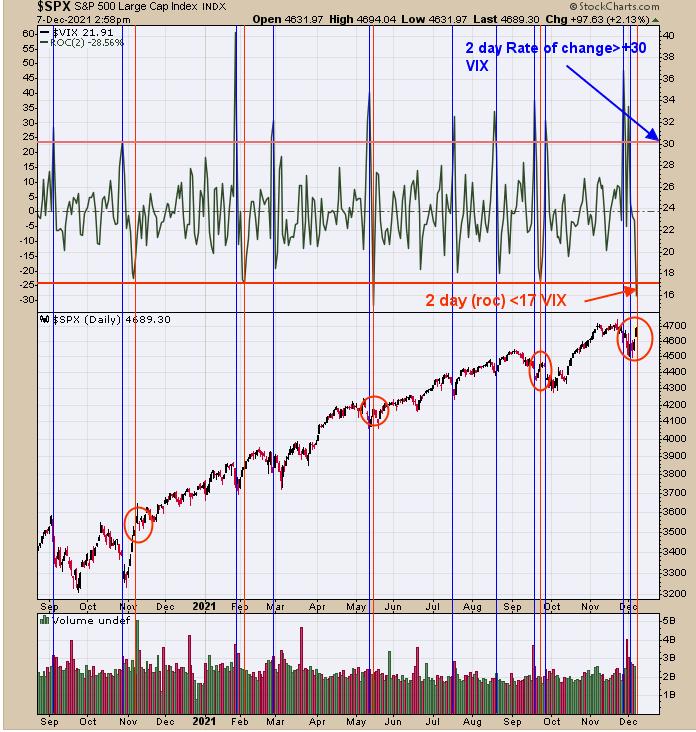
Yesterday, we said, "The top window is the 2-day "Rate of change" (ROC) for the VIX. This is another way to measure panic in the market is when the VIX spikes. And the rate of the spike in the VIX determines the degree of panic. This chart goes back over a year and shows the times when the 2-day ROC of the VIX reached above 30." The spike above +30 was marked with blue lines. The red lines mark times when the 2-day ROC for the VIX drops below +17. The fast drop in the VIX below +17 shows exuberance and can stall the market short term. The red circles show the times when the 2 day ROC VIX dropped below +17 and the market stalled. As you can see, we are at that level now. Still bullish, but the market could stall short term before heading higher. Seasonality is favorable for the month of December.
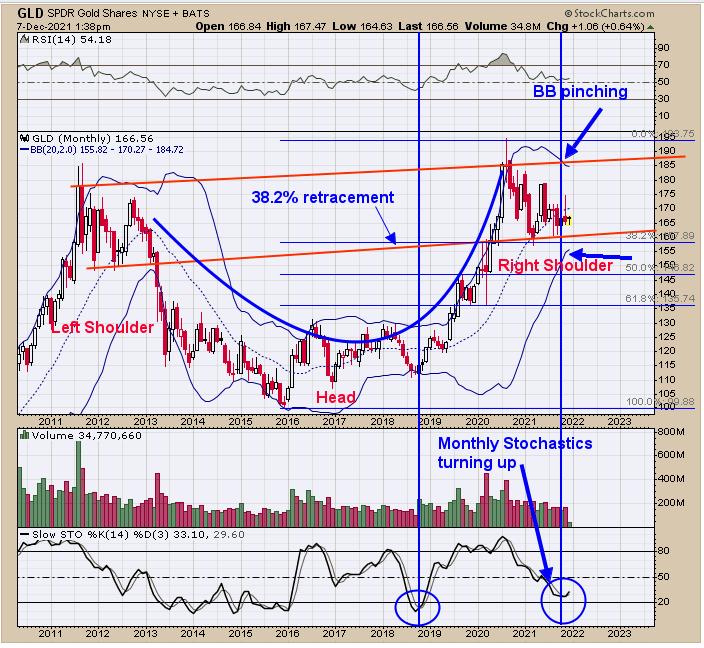
Yesterday, we pointed out on the daily gold chart a potential Head-and-Shoulders patterns forming, which dates back to 8/20, and that the Slow Stochastic was oversold and has turned up. Above is the monthly GLD (ETF for Gold). The monthly Slow Stochastic is also oversold and also has turned up. The monthly pattern forming on GLD also appears to be forming a Head-and-Shoulders bottom. The Right Shoulder is near completion as the Bollinger Bands are pinching. The monthly Right Shoulder is the daily Head-and-Shoulders on last night's report. GLD has been consolidating since August 2020 and has only retraced 38.2% of its rally from the 2015 low. When a market only retraces 38.2% of its previous rally, this condition suggests market is at the halfway point of the move up. To do the math, this would give a target near 250 on GLD. With the monthly and daily Slow Stochastic turning, it would suggest gold rally has started.
Tim Ord,
Editor
www.ord-oracle.com. New Book release "The Secret Science of Price and Volume" by Timothy Ord, buy at www.Amazon.com.