
SPX Monitoring Purposes: Long SPX on 2/6/23 at 4110.98.
Monitoring Purposes GOLD: Long GDX on 10/9/20 at 40.78.
Long Term SPX Monitor Purposes: Neutral.
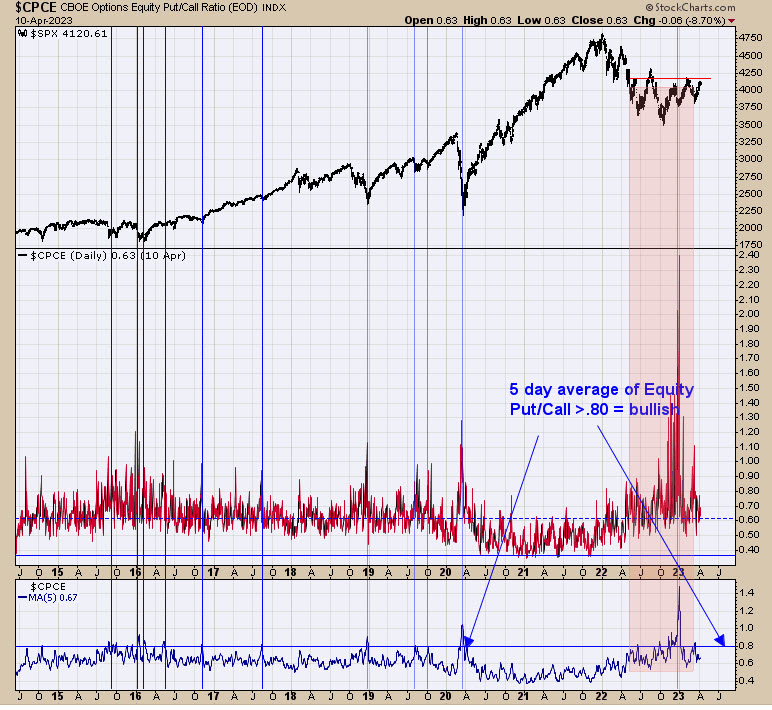
Above is a sentiment indicator, the 5-day average of the CBOE Equity put/ call ratio (bottom window). It's fairly rare (near once a year) for the 5-day average of the CBOE equity put/call ratio to reach .80 and higher. We noted those times previously prior to 2022 with blue lines. Notice that when the 5-day average of the Equity put/call ratio reached above .80, the market was at an important low. It has reached .80 and higher numerous times since May of last year (noted in light pink). Previously, it only took one time for the 5-day average Equity Put/call ratio to reach >.80 for the market to bottom. We now have numerous times the ratio reached .80 going back to May of last year, which in turn could add fuel to the next rally. Food for thought; in pre-election years (this year) April is up 94% of the time. If January was up (it was up over 6%)m April is up 88% of the time.
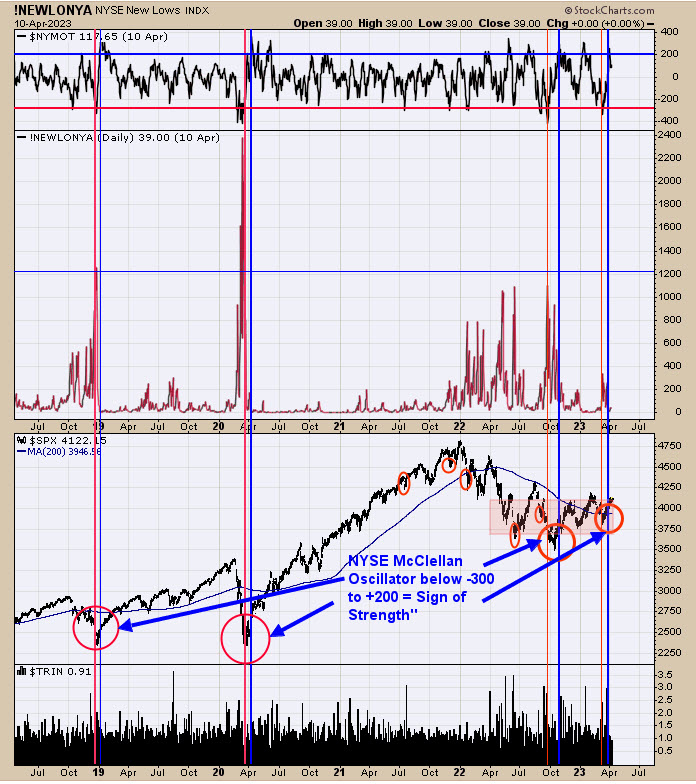
We said yesterday, and it still holds true, that "The top window is the NYSE McClellan Oscillator. A 'Selling Climax' occurs when the Oscillator falls below minus 300 and a 'Sign of Strength' forms when the Oscillator rallies above +200 and, in turn, signals an intermediate term low. We have identified the times when the Oscillator reached -300 (red line) than rallied to +200 (blue line). Notice that we have had two instances of a 'Selling Climax' and 'Sign of Strength' over the last several months, which may give extra power to the this potential bottom process."
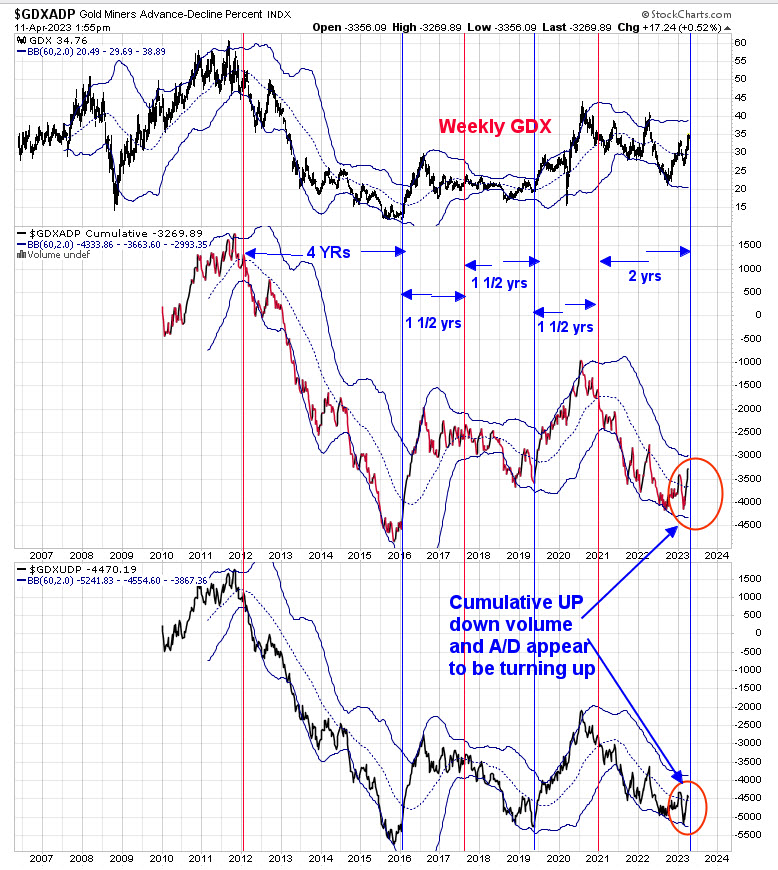
We previously posted this chart, which is now updated to today's trading. Above is the weekly GDX chart, along with the weekly Cumulative GDX Up Down volume percent (bottom window), and the next higher window is the weekly cumulative GDX Advance/Decline percent. This setup works well on the bigger timeframe. We put Bollinger Bands on both GDX indicators. When both indicators close above their mid Bollinger Band, a buy signal is triggered (noted with the blue line) and when both indicators close below their mid Bollinger Band, a sell signal is triggered (noted with red line). We noted the time between the signals in the middle window, and all lasted at least 1 ½ years. The current buy signal was triggered in March of this year, and adding 1 ½ years to the current signal will give a time for the next high in September 2024, but could be extended for many months as this is the least amount of time expected.
Tim Ord,
Editor
www.ord-oracle.com. Book release "The Secret Science of Price and Volume" by Timothy Ord, buy at www.Amazon.com.
Signals are provided as general information only and are not investment recommendations. You are responsible for your own investment decisions. Past performance does not guarantee future performance. Opinions are based on historical research and data believed reliable; there is no guarantee results will be profitable. Not responsible for errors or omissions. I may invest in the vehicles mentioned above.