The market's leadership is changing, just in time for the Fed's next rate increase. And the stocks of companies where there are tight supplies of products look poised to make a big move.
The market is expecting another 25 basis point rate hike on July 26. I see no reason to disagree. I'm more interested in what the market does in response, and I'm already seeing signs that the smart money is making bets on sectors where product supplies are tightening.
Moving on, the bloom is off the rose on AI, for now, as Taiwan Semiconductors (TSM), on July 20, missed on its earnings, downgraded its guidance, and forecasted a future glut of semiconductors, which its CEO noted is unlikely to be offset by demand from the AI sector. Oops!
On the same day, homebuilder DR Horton (DHI) delivered a hefty beat of expectations, offered stable guidance, and yet the stock also tanked. But while TSM's shares continued to drop, DHI may have found support. The difference between the two is the underlying supply-demand scenario for their respective products.
Expect a Continued Supply Squeeze in Key Economic Sectors
In the past few weeks, I've highlighted the bullish influence of tight supplies on key market sectors, such as oil, which I discussed in detail here.
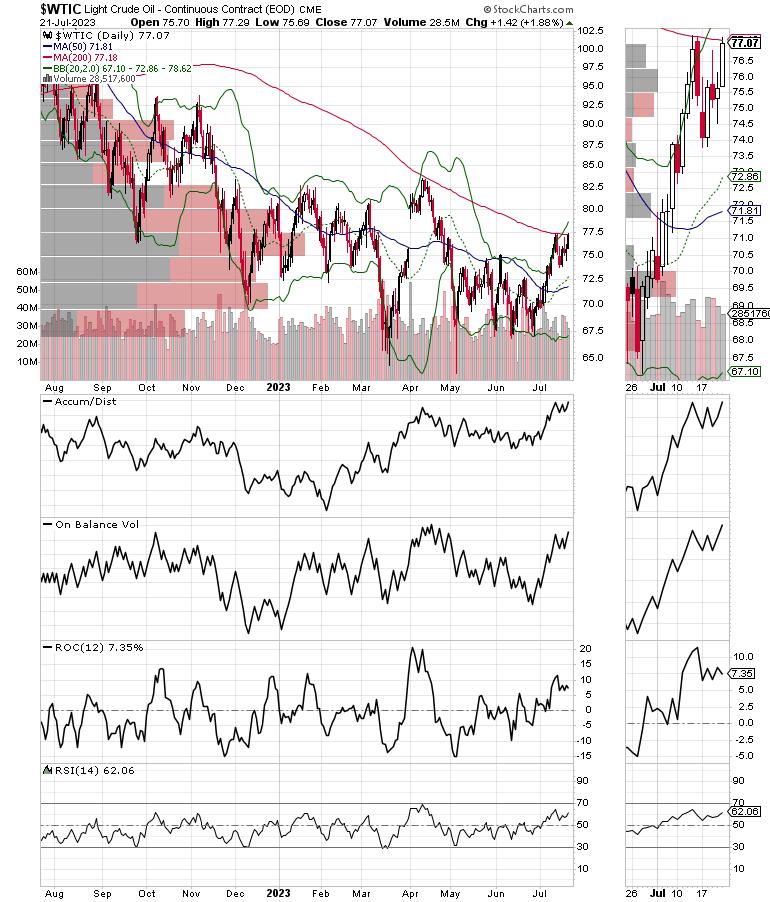
Since that article was published (5/28/23), West Texas Intermediate Crude (WTIC) is up nearly $10 per barrel, with the price now testing the 200-day moving average. A move above the $80 per barrel price now looks like a reasonable expectation as oil producers are gradually turning off the spigots. In 2023, there are 100 fewer operating rigs in the U.S. compared to 2022. OPEC and Russia are also cutting production.

The NYSE Oil Index ($XOI) of oil stocks has already crossed its 200-day moving average, marking its return to bull market territory. I've been building positions in energy stocks for the past several weeks. So far, so good.

In contrast, TSM crashed in response to its bearish supply forecast for the chip market. Indeed, the price chart shows the decline was well forecast by the stock's double top, which developed prior to the earnings announcement.
Moreover, Accumulation/Distribution topped out with the stock and began dropping as short sellers built positions. In addition, On Balance Volume (OBV) rolled over soon after ADI, as the smart money began to sell the stock outright. The drop in both indicators accelerated on the news suggesting the selling, which has taken the stock below its 50-day moving average. Given the status of the Volume-by-Price (VBP) bars on the chart, the $85 area near the 200-day moving average is a reasonable longer-term target on the downside.
Meanwhile, DHI found support at its 20-day moving average after sellers took profits. That's because DHI beat its estimates handily and raised its guidance for the rest of the year—housing supplies remain tight, demand is stable, and the company continues to manage its inventory to ensure balance and maintain its earnings and profit margins.

All of this, until proven otherwise, adds up to the current decline being a short-term pullback for DHI. This, of course, could change depending on what the Fed does and how it affects bond yields and mortgage rates. As I detail below, supply remains on the side of the homebuilders.
I own shares in DHI, which is currently a long-term holding at Joe Duarte in the Money Options.com. You can have a look at the entire portfolio, and my latest recommendations on what to do with your homebuilder shares FREE with a two week trial subscription.
Homebuilders are in a Sweet Spot
According to Redfin, 90% of homeowners hold mortgages with rates below 6%. Nearly 25% are paying 3%. Redfin adds that only 14 out of 1000 homes in the US are now exchanging hands, compared to 19 of 1000 homes in 2019.
Homeowners don't want to sell since a new home would mean a higher mortgage. Homebuilders are building just enough homes to keep up with demand, ensuring profit margins. The result is record-low supplies of homes and a homebuilder sweet spot.
So, why did the homebuilders take a beating on July 20, 2023? Partially, it was out of fear of the Fed, as yields on the 10-Year US Treasury Yield Index ($TNX) climbed on the same day. Yet, by the next day, yields retraced their rise, although TNX remained above 3.8%. As you can see, mortgage rates finally caught up to the lower bond yields, which occurred in early July. This also built a floor under DHI and the rest of the homebuilders after the July 20 decline.
Meanwhile, analysts are reducing their outlook on homebuilders, expecting an increase in supplies once the Fed lowers interest rates. But here's the rub. Redfin's survey concludes that most potential existing home sellers would not consider listing their home until mortgage rates fall to 5%. Since the average 30-year mortgage is currently hovering near 6.5-7%, bond yields would have to fall two points from current levels to reach the magic 5% number. That would be a yield on the TNX of between 1.5 to 2%, which would mean that the economy has slowed drastically.
Bottom Line
Until proven otherwise, sectors where product supplies are tight, especially in the face of stable or high demand, are going to fare better over the next few months. Think oil. Think homebuilders. Think agricultural and commodity products.
My subscribers have been taking profits in both homebuilders and AI stocks for weeks. Now, we're heeding our sell stops and will wait to see what happens with both these sectors after the Fed makes its move.
As I described in my latest Your Daily Five video, and as I described above I follow the footprints left by the smart money. You can see where the smart money is flowing to now with a FREE trial to my service by clicking here.
Incidentally, if you're looking for more in-depth actionable data on real estate, an area where the smart money is currently building positions, check out my Weekly Real Estate Report here.
New Highs on NYAD
As I said last week, the long-term trend for stocks remains up. The New York Stock Exchange Advance Decline line ($NYAD) remains stable for now as it remains above its 50 and 200-day moving averages.

Last week, I noted that the Nasdaq 100 Index ($NDX) was overdue for a consolidation, as illustrated by its reversal we saw on July 15, 2023, outside the upper Bollinger Band. The bad news from Taiwan Semiconductor was just the excuse for the selling. Still, ADI and OBV, although they've rolled over in the short term, remain in uptrends. Support is at now at 15,250 and the 20-day moving average.
The S&P 500 ($SPX) is acting a bit better. Both ADI and OBV are showing signs of some profit-taking. There is support at 4300-4450.
VIX Holds Steady
I've been expecting a move higher in VIX, but it hasn't materialized. When this happens, it usually leads to stable-to-higher stock prices. The key is whether VIX can rise above the 15 level convincingly.
When the VIX rises, stocks tend to fall, as rising put volume is a sign that market makers are selling stock index futures to hedge their put sales to the public. A fall in VIX is bullish, as it means less put option buying, and it eventually leads to call buying, which causes market makers to hedge by buying stock index futures. This raises the odds of higher stock prices.
Liquidity Remains Stable
As it has for the past few weeks, liquidity has been stable. This is one of the reasons the market has been in a bullish trend. The Secured Overnight Financing Rate ($SOFR), which recently replaced the Eurodollar Index ($XED), is an equal sign of the market's liquidity. SOFR remains range bound, which is relatively bullish. A move below 5 would be more bullish. A rise above 5.1% would be bearish.
To get the latest information on options trading, check out Options Trading for Dummies, now in its 4th Edition—Get Your Copy Now! Now also available in Audible audiobook format!
 #1 New Release on Options Trading!
Good news! I've made my NYAD-Complexity - Chaos chart (featured on my YD5 videos) and a few other favorites public. You can find them here.
Joe Duarte
In The Money Options
Joe Duarte is a former money manager, an active trader, and a widely recognized independent stock market analyst since 1987. He is author of eight investment books, including the best-selling Trading Options for Dummies, rated a TOP Options Book for 2018 by Benzinga.com and now in its third edition, plus The Everything Investing in Your 20s and 30s Book and six other trading books.
The Everything Investing in Your 20s and 30s Book is available at Amazon and Barnes and Noble. It has also been recommended as a Washington Post Color of Money Book of the Month.
To receive Joe's exclusive stock, option and ETF recommendations, in your mailbox every week visit https://joeduarteinthemoneyoptions.com/secure/order_email.asp.
